|
Download Data (XLS File) |
|
||||||||
|
||||||||
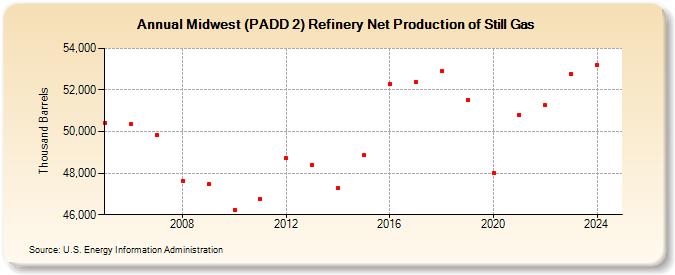
| Midwest (PADD 2) Refinery Net Production of Still Gas (Thousand Barrels) | ||||||||
| Decade | Year-0 | Year-1 | Year-2 | Year-3 | Year-4 | Year-5 | Year-6 | Year-7 | Year-8 | Year-9 |
|---|---|---|---|---|---|---|---|---|---|---|
| 2000's | 50,432 | 50,344 | 49,855 | 47,641 | 47,454 | |||||
| 2010's | 46,240 | 46,745 | 48,708 | 48,410 | 47,261 | 48,849 | 52,278 | 52,386 | 52,895 | 51,528 |
| 2020's | 48,003 | 50,809 | 51,261 | 52,634 |
| - = No Data Reported; -- = Not Applicable; NA = Not Available; W = Withheld to avoid disclosure of individual company data. |
| Release Date: 3/29/2024 |
| Next Release Date: 8/30/2024 |
Referring Pages: