|
Download Data (XLS File) |
|
||||||||
|
||||||||
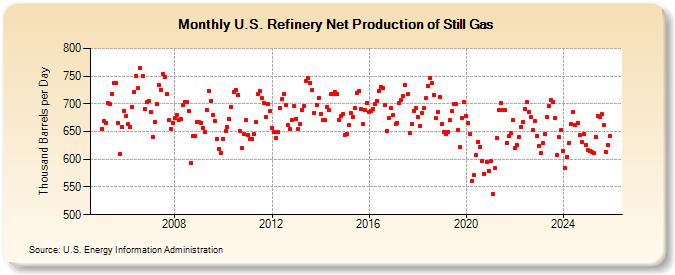
| U.S. Refinery Net Production of Still Gas (Thousand Barrels per Day) | ||||||||
| Year | Jan | Feb | Mar | Apr | May | Jun | Jul | Aug | Sep | Oct | Nov | Dec |
|---|---|---|---|---|---|---|---|---|---|---|---|---|
| 2005 | 655 | 669 | 666 | 701 | 699 | 718 | 737 | 737 | 665 | 610 | 659 | 687 |
| 2006 | 678 | 664 | 658 | 695 | 722 | 751 | 728 | 764 | 751 | 690 | 703 | 705 |
| 2007 | 686 | 640 | 668 | 700 | 734 | 725 | 753 | 749 | 717 | 670 | 655 | 665 |
| 2008 | 674 | 680 | 671 | 673 | 697 | 704 | 703 | 687 | 594 | 642 | 642 | 668 |
| 2009 | 667 | 666 | 656 | 650 | 689 | 724 | 706 | 680 | 669 | 637 | 618 | 612 |
| 2010 | 637 | 651 | 659 | 673 | 694 | 722 | 725 | 716 | 651 | 620 | 645 | 670 |
| 2011 | 643 | 637 | 637 | 645 | 668 | 718 | 723 | 710 | 702 | 676 | 699 | 687 |
| 2012 | 657 | 649 | 638 | 649 | 693 | 709 | 718 | 697 | 661 | 654 | 670 | 696 |
| 2013 | 673 | 655 | 663 | 689 | 696 | 742 | 746 | 738 | 725 | 684 | 698 | 711 |
| 2014 | 681 | 670 | 670 | 694 | 689 | 717 | 718 | 722 | 718 | 671 | 678 | 681 |
| 2015 | 644 | 645 | 661 | 684 | 676 | 693 | 720 | 723 | 691 | 663 | 688 | 702 |
| 2016 | 686 | 687 | 691 | 700 | 706 | 724 | 731 | 728 | 697 | 651 | 675 | 692 |
| 2017 | 680 | 664 | 666 | 701 | 707 | 715 | 734 | 717 | 647 | 663 | 687 | 693 |
| 2018 | 676 | 660 | 684 | 692 | 710 | 733 | 746 | 737 | 716 | 675 | 686 | 713 |
| 2019 | 664 | 650 | 645 | 650 | 670 | 687 | 700 | 699 | 652 | 623 | 675 | 703 |
| 2020 | 678 | 666 | 646 | 560 | 571 | 608 | 632 | 623 | 596 | 574 | 595 | 579 |
| 2021 | 596 | 537 | 584 | 639 | 689 | 701 | 689 | 688 | 629 | 642 | 647 | 670 |
| 2022 | 621 | 626 | 641 | 659 | 668 | 691 | 703 | 685 | 676 | 652 | 669 | 642 |
| 2023 | 619 | 613 | 629 | 652 | 683 | 698 | 706 | 700 | 672 | 607 | 640 | 653 |
| 2024 | 615 | |||||||||||
| - = No Data Reported; -- = Not Applicable; NA = Not Available; W = Withheld to avoid disclosure of individual company data. |
| Release Date: 3/29/2024 |
| Next Release Date: 4/30/2024 |
Referring Pages: