|
Download Data (XLS File) |
|
||||||||
|
||||||||
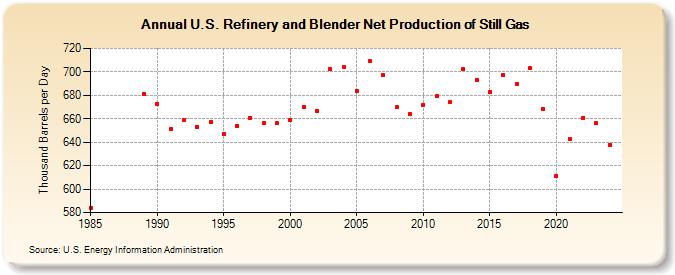
| U.S. Refinery and Blender Net Production of Still Gas (Thousand Barrels per Day) | ||||||||
| Decade | Year-0 | Year-1 | Year-2 | Year-3 | Year-4 | Year-5 | Year-6 | Year-7 | Year-8 | Year-9 |
|---|---|---|---|---|---|---|---|---|---|---|
| 1980's | 584 | 681 | ||||||||
| 1990's | 673 | 651 | 659 | 653 | 657 | 647 | 654 | 661 | 656 | 656 |
| 2000's | 659 | 670 | 667 | 702 | 704 | 684 | 709 | 697 | 670 | 664 |
| 2010's | 672 | 679 | 674 | 702 | 693 | 683 | 697 | 690 | 703 | 668 |
| 2020's | 611 | 643 | 661 | 656 |
| - = No Data Reported; -- = Not Applicable; NA = Not Available; W = Withheld to avoid disclosure of individual company data. |
| Release Date: 3/29/2024 |
| Next Release Date: 8/30/2024 |