|
Download Data (XLS File) |
|
||||||||
|
||||||||
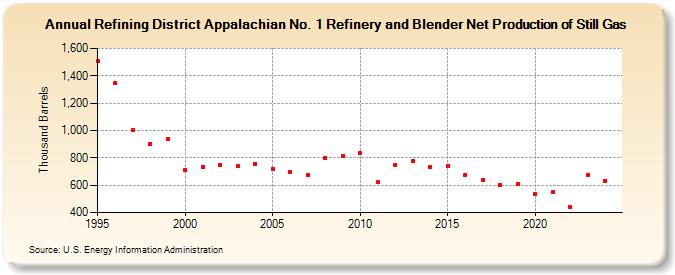
| Refining District Appalachian No. 1 Refinery and Blender Net Production of Still Gas (Thousand Barrels) | ||||||||
| Decade | Year-0 | Year-1 | Year-2 | Year-3 | Year-4 | Year-5 | Year-6 | Year-7 | Year-8 | Year-9 |
|---|---|---|---|---|---|---|---|---|---|---|
| 1990's | 1,507 | 1,350 | 1,004 | 903 | 935 | |||||
| 2000's | 708 | 730 | 747 | 738 | 756 | 720 | 693 | 673 | 801 | 810 |
| 2010's | 832 | 621 | 749 | 777 | 733 | 743 | 672 | 637 | 604 | 608 |
| 2020's | 535 | 550 | 439 | 674 |
| - = No Data Reported; -- = Not Applicable; NA = Not Available; W = Withheld to avoid disclosure of individual company data. |
| Release Date: 3/29/2024 |
| Next Release Date: 8/30/2024 |