|
Download Data (XLS File) |
|
||||||||
|
||||||||
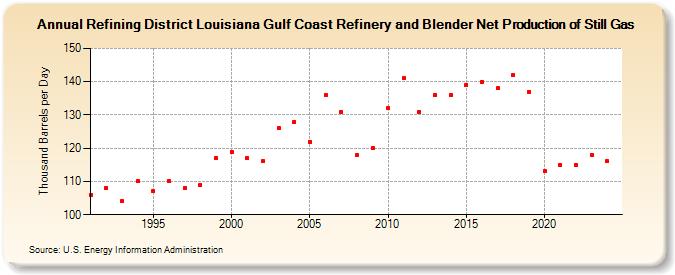
| Refining District Louisiana Gulf Coast Refinery and Blender Net Production of Still Gas (Thousand Barrels per Day) | ||||||||
| Decade | Year-0 | Year-1 | Year-2 | Year-3 | Year-4 | Year-5 | Year-6 | Year-7 | Year-8 | Year-9 |
|---|---|---|---|---|---|---|---|---|---|---|
| 1990's | 106 | 108 | 104 | 110 | 107 | 110 | 108 | 109 | 117 | |
| 2000's | 119 | 117 | 116 | 126 | 128 | 122 | 136 | 131 | 118 | 120 |
| 2010's | 132 | 141 | 131 | 136 | 136 | 139 | 140 | 138 | 142 | 137 |
| 2020's | 113 | 115 | 115 | 118 |
| - = No Data Reported; -- = Not Applicable; NA = Not Available; W = Withheld to avoid disclosure of individual company data. |
| Release Date: 3/29/2024 |
| Next Release Date: 8/30/2024 |