|
Download Data (XLS File) |
|
||||||||
|
||||||||
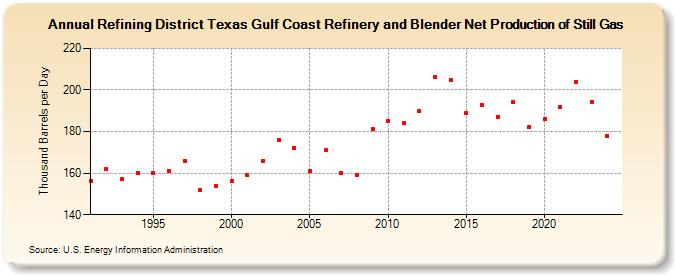
| Refining District Texas Gulf Coast Refinery and Blender Net Production of Still Gas (Thousand Barrels per Day) | ||||||||
| Decade | Year-0 | Year-1 | Year-2 | Year-3 | Year-4 | Year-5 | Year-6 | Year-7 | Year-8 | Year-9 |
|---|---|---|---|---|---|---|---|---|---|---|
| 1990's | 156 | 162 | 157 | 160 | 160 | 161 | 166 | 152 | 154 | |
| 2000's | 156 | 159 | 166 | 176 | 172 | 161 | 171 | 160 | 159 | 181 |
| 2010's | 185 | 184 | 190 | 206 | 205 | 189 | 193 | 187 | 194 | 182 |
| 2020's | 186 | 192 | 204 | 194 |
| - = No Data Reported; -- = Not Applicable; NA = Not Available; W = Withheld to avoid disclosure of individual company data. |
| Release Date: 3/29/2024 |
| Next Release Date: 8/30/2024 |