|
Download Data (XLS File) |
|
||||||||
|
||||||||
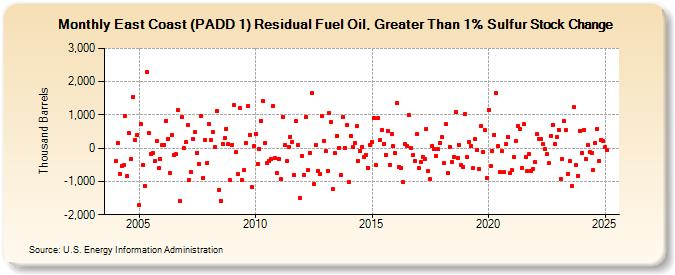
| East Coast (PADD 1) Residual Fuel Oil, Greater Than 1% Sulfur Stock Change (Thousand Barrels) | ||||||||
| Year | Jan | Feb | Mar | Apr | May | Jun | Jul | Aug | Sep | Oct | Nov | Dec |
|---|---|---|---|---|---|---|---|---|---|---|---|---|
| 2004 | -395 | 153 | -762 | -549 | -520 | 967 | -830 | 447 | -311 | 1,533 | 243 | 389 |
| 2005 | -1,717 | 723 | -504 | -1,122 | 2,284 | 444 | -162 | -135 | -378 | 204 | -601 | -315 |
| 2006 | 83 | 105 | 827 | 278 | -744 | 388 | -191 | -184 | 1,146 | -1,597 | 930 | 0 |
| 2007 | 177 | 685 | -942 | -720 | 266 | 485 | -140 | -466 | 982 | -886 | 255 | -437 |
| 2008 | 736 | 233 | 487 | 25 | 1,117 | -1,257 | -1,579 | 127 | 297 | 591 | 123 | -970 |
| 2009 | 106 | 1,285 | -109 | -772 | 1,205 | -956 | -651 | 163 | 1,273 | 409 | -1,177 | 51 |
| 2010 | 430 | -468 | -12 | 827 | 1,409 | 156 | -451 | -382 | -329 | 1,263 | -306 | -748 |
| 2011 | -315 | -935 | 936 | 90 | -396 | 30 | 349 | 195 | -813 | 814 | 99 | -1,488 |
| 2012 | -227 | -799 | 945 | -661 | -137 | 1,657 | -1,080 | 84 | -690 | -782 | 965 | 218 |
| 2013 | -99 | -672 | 1,055 | 789 | -1,234 | -158 | 381 | 16 | -802 | 935 | 15 | 690 |
| 2014 | -1,022 | 377 | 32 | 170 | 653 | -376 | -88 | 38 | -274 | -199 | -581 | 109 |
| 2015 | 199 | 906 | -501 | 910 | 252 | 551 | 135 | -196 | 531 | -494 | 441 | 51 |
| 2016 | -151 | 1,361 | -570 | -581 | -1,021 | 111 | 79 | 991 | 12 | -214 | -381 | 414 |
| 2017 | -596 | -406 | -253 | -321 | 584 | -674 | -934 | 68 | -37 | -223 | -39 | 164 |
| 2018 | 328 | -457 | 719 | -748 | 37 | -419 | -258 | 1,078 | -298 | 104 | -499 | -572 |
| 2019 | 1,018 | -275 | 200 | 71 | -605 | 274 | -48 | -624 | 654 | -112 | 535 | -884 |
| 2020 | 1,160 | -547 | -88 | 411 | 1,667 | 64 | -721 | -95 | -728 | 115 | 348 | -756 |
| 2021 | -668 | -268 | 205 | 673 | 573 | -594 | 719 | -272 | -682 | -175 | -694 | -613 |
| 2022 | -410 | 425 | 286 | 273 | 115 | -36 | -188 | -453 | 363 | 706 | 121 | 333 |
| 2023 | 560 | -919 | -331 | 812 | 545 | -766 | -399 | -1,139 | 1,228 | -498 | -826 | 526 |
| 2024 | -132 | |||||||||||
| - = No Data Reported; -- = Not Applicable; NA = Not Available; W = Withheld to avoid disclosure of individual company data. |
| Release Date: 3/29/2024 |
| Next Release Date: 4/30/2024 |