|
Download Data (XLS File) |
|
||||||||
|
||||||||
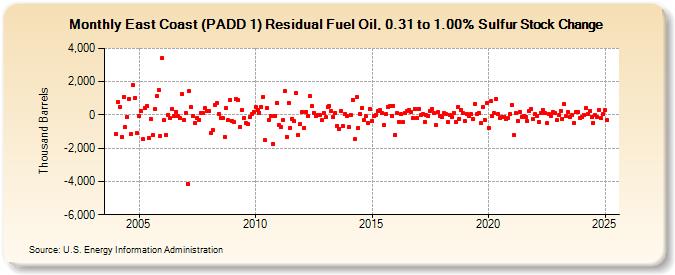
| East Coast (PADD 1) Residual Fuel Oil, 0.31 to 1.00% Sulfur Stock Change (Thousand Barrels) | ||||||||
| Year | Jan | Feb | Mar | Apr | May | Jun | Jul | Aug | Sep | Oct | Nov | Dec |
|---|---|---|---|---|---|---|---|---|---|---|---|---|
| 2004 | -1,137 | 800 | 498 | -1,323 | 1,101 | -743 | -135 | 971 | -1,136 | 1,790 | 1,039 | -1,117 |
| 2005 | -72 | 260 | -1,463 | 428 | 513 | -1,387 | -254 | -1,193 | 331 | 1,131 | 1,505 | -1,281 |
| 2006 | 3,413 | -294 | -1,204 | 12 | -191 | 380 | -61 | 180 | -67 | -192 | 1,248 | -324 |
| 2007 | 124 | -4,145 | 1,437 | 461 | -39 | -474 | -163 | -288 | 98 | 99 | 398 | 230 |
| 2008 | 219 | -1,072 | -910 | 626 | 692 | 71 | -174 | -164 | -1,314 | 386 | -330 | 926 |
| 2009 | -372 | -443 | 957 | 875 | -707 | 306 | -194 | -503 | -562 | -143 | 49 | 178 |
| 2010 | 503 | 272 | 128 | 484 | 1,095 | -1,534 | 411 | -282 | -75 | -1,730 | -80 | 737 |
| 2011 | -636 | -718 | -327 | 1,431 | -1,308 | 746 | -769 | -221 | -389 | 1,303 | -1,191 | -567 |
| 2012 | 185 | -763 | 198 | -82 | 1,128 | 534 | 137 | -39 | 8 | -20 | -326 | 88 |
| 2013 | -153 | 487 | 550 | 212 | -103 | 142 | -639 | -830 | 232 | -659 | 72 | -47 |
| 2014 | -756 | 22 | 926 | -1,472 | 1,062 | -780 | 66 | 432 | -293 | -93 | -500 | 329 |
| 2015 | -372 | -74 | 20 | 243 | 293 | 121 | -596 | 35 | 500 | 519 | -64 | 558 |
| 2016 | -1,204 | 87 | -396 | 47 | -449 | 109 | 249 | 271 | 183 | -195 | 372 | -189 |
| 2017 | 383 | -11 | 31 | -402 | -20 | -66 | 256 | 357 | 115 | -631 | 178 | -55 |
| 2018 | -141 | 128 | 43 | -432 | 9 | -154 | 131 | -450 | 456 | -221 | 305 | 108 |
| 2019 | -385 | 31 | -66 | 37 | -239 | 660 | 55 | 123 | -499 | 499 | -277 | 719 |
| 2020 | -770 | 808 | -76 | 104 | 944 | 60 | -189 | -138 | -100 | -261 | -164 | 45 |
| 2021 | 614 | -1,232 | 89 | -375 | 183 | -105 | -62 | -111 | -392 | 250 | 343 | -259 |
| 2022 | 30 | -38 | -424 | 145 | 319 | 91 | -495 | 33 | -61 | 169 | 115 | -335 |
| 2023 | -33 | 251 | -231 | 382 | -131 | 529 | -116 | -29 | -472 | 171 | 171 | -178 |
| 2024 | -110 | |||||||||||
| - = No Data Reported; -- = Not Applicable; NA = Not Available; W = Withheld to avoid disclosure of individual company data. |
| Release Date: 3/29/2024 |
| Next Release Date: 4/30/2024 |