|
Download Data (XLS File) |
|
||||||||
|
||||||||
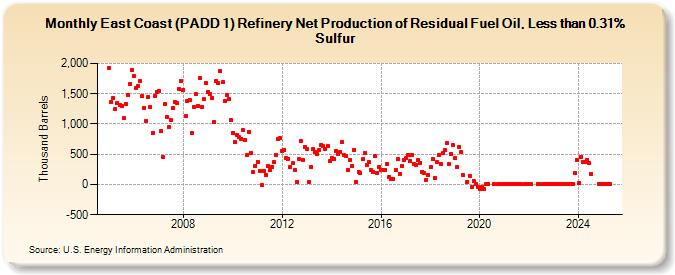
| East Coast (PADD 1) Refinery Net Production of Residual Fuel Oil, Less than 0.31% Sulfur (Thousand Barrels) | ||||||||
| Year | Jan | Feb | Mar | Apr | May | Jun | Jul | Aug | Sep | Oct | Nov | Dec |
|---|---|---|---|---|---|---|---|---|---|---|---|---|
| 2005 | 1,933 | 1,360 | 1,437 | 1,243 | 1,343 | 1,318 | 1,289 | 1,091 | 1,338 | 1,479 | 1,665 | 1,895 |
| 2006 | 1,796 | 1,597 | 1,628 | 1,709 | 1,464 | 1,272 | 1,048 | 1,452 | 1,286 | 852 | 1,465 | 1,530 |
| 2007 | 1,553 | 878 | 448 | 1,325 | 1,123 | 956 | 1,062 | 1,270 | 1,360 | 1,343 | 1,577 | 1,703 |
| 2008 | 1,564 | 1,125 | 1,373 | 1,398 | 852 | 1,282 | 1,499 | 1,298 | 1,758 | 1,283 | 1,405 | 1,680 |
| 2009 | 1,524 | 1,492 | 1,435 | 1,037 | 1,716 | 1,680 | 1,869 | 1,687 | 1,377 | 1,485 | 1,418 | 1,060 |
| 2010 | 851 | 699 | 816 | 780 | 757 | 896 | 743 | 491 | 872 | 524 | 209 | 313 |
| 2011 | 373 | 226 | -13 | 228 | 161 | 305 | 238 | 288 | 369 | 492 | 744 | 760 |
| 2012 | 553 | 575 | 436 | 421 | 282 | 349 | 231 | 43 | 420 | 720 | 397 | 617 |
| 2013 | 586 | 36 | 290 | 582 | 534 | 511 | 575 | 658 | 635 | 590 | 628 | 380 |
| 2014 | 434 | 420 | 553 | 507 | 531 | 701 | 491 | 475 | 237 | 410 | 307 | 571 |
| 2015 | 48 | 208 | 183 | 416 | 521 | 323 | 373 | 239 | 201 | 463 | 190 | 289 |
| 2016 | 240 | 231 | 233 | 337 | 124 | 88 | 95 | 237 | 417 | 180 | 307 | 410 |
| 2017 | 433 | 494 | 380 | 480 | 338 | 326 | 408 | 360 | 211 | 184 | 81 | 161 |
| 2018 | 282 | 423 | 115 | 375 | 483 | 341 | 525 | 567 | 685 | 339 | 505 | 647 |
| 2019 | 437 | 290 | 626 | 532 | 149 | 41 | 142 | -37 | 51 | 11 | -35 | |
| 2020 | -81 | -36 | -83 | 1 | 9 | 4 | 4 | 2 | 2 | |||
| 2021 | 1 | 3 | 3 | 2 | 1 | 3 | 3 | 2 | 3 | 6 | 2 | |
| 2022 | 3 | 1 | 4 | 2 | 5 | 2 | 7 | 3 | 11 | |||
| 2023 | 11 | 7 | 7 | 6 | 4 | 3 | 6 | 3 | 2 | 4 | 186 | 409 |
| 2024 | 31 | |||||||||||
| - = No Data Reported; -- = Not Applicable; NA = Not Available; W = Withheld to avoid disclosure of individual company data. |
| Release Date: 3/29/2024 |
| Next Release Date: 4/30/2024 |