|
Download Data (XLS File) |
|
||||||||
|
||||||||
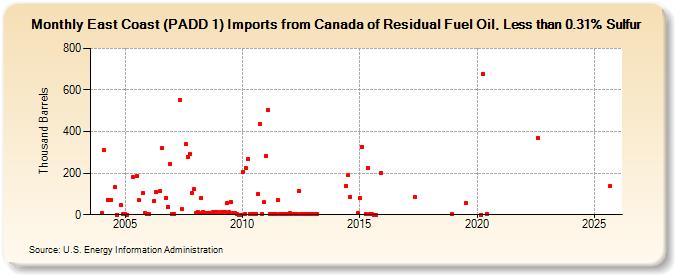
| East Coast (PADD 1) Imports from Canada of Residual Fuel Oil, Less than 0.31% Sulfur (Thousand Barrels) | ||||||||
| Year | Jan | Feb | Mar | Apr | May | Jun | Jul | Aug | Sep | Oct | Nov | Dec |
|---|---|---|---|---|---|---|---|---|---|---|---|---|
| 2004 | 8 | 309 | 71 | 73 | 133 | 1 | 45 | 3 | ||||
| 2005 | 3 | 1 | 182 | 186 | 69 | 104 | 6 | 2 | ||||
| 2006 | 2 | 65 | 108 | 113 | 320 | 82 | 39 | 246 | ||||
| 2007 | 2 | 3 | 552 | 28 | 340 | 280 | 293 | 106 | 122 | |||
| 2008 | 7 | 11 | 8 | 81 | 11 | 9 | 10 | 10 | 10 | 13 | 12 | 14 |
| 2009 | 12 | 11 | 13 | 55 | 11 | 60 | 8 | 6 | 5 | 1 | 1 | |
| 2010 | 204 | 3 | 223 | 267 | 4 | 4 | 5 | 5 | 99 | 437 | 5 | 61 |
| 2011 | 283 | 505 | 2 | 2 | 2 | 3 | 72 | 3 | 2 | 2 | 2 | 2 |
| 2012 | 7 | 3 | 4 | 4 | 3 | 113 | 4 | 3 | 3 | 3 | 3 | 3 |
| 2013 | 4 | 3 | 3 | |||||||||
| 2014 | 140 | 189 | 86 | 9 | ||||||||
| 2015 | 78 | 328 | 2 | 225 | 2 | 2 | 1 | 1 | 201 | |||
| 2017 | 85 | |||||||||||
| 2018 | 2 | |||||||||||
| 2019 | 57 | |||||||||||
| 2020 | 1 | 679 | 3 | |||||||||
| 2022 | 371 | |||||||||||
| - = No Data Reported; -- = Not Applicable; NA = Not Available; W = Withheld to avoid disclosure of individual company data. |
| Release Date: 8/30/2024 |
| Next Release Date: 9/30/2024 |