|
Download Data (XLS File) |
|
||||||||
|
||||||||
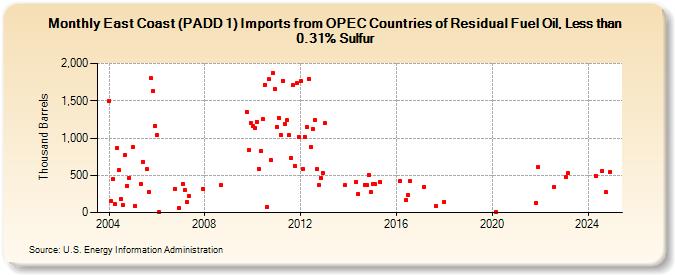
| East Coast (PADD 1) Imports from OPEC Countries of Residual Fuel Oil, Less than 0.31% Sulfur (Thousand Barrels) | ||||||||
| Year | Jan | Feb | Mar | Apr | May | Jun | Jul | Aug | Sep | Oct | Nov | Dec |
|---|---|---|---|---|---|---|---|---|---|---|---|---|
| 2004 | 1,500 | 149 | 444 | 113 | 869 | 565 | 183 | 108 | 775 | 363 | 464 | |
| 2005 | 882 | 92 | 384 | 685 | 578 | 278 | 1,805 | 1,626 | 1,163 | |||
| 2006 | 1,037 | 4 | 320 | 56 | ||||||||
| 2007 | 388 | 300 | 140 | 226 | 321 | |||||||
| 2008 | 367 | |||||||||||
| 2009 | 1,353 | 841 | 1,199 | |||||||||
| 2010 | 1,162 | 1,140 | 1,218 | 590 | 824 | 1,252 | 1,716 | 81 | 1,786 | 704 | 1,876 | 1,658 |
| 2011 | 1,154 | 1,272 | 1,042 | 1,770 | 1,194 | 1,237 | 1,037 | 730 | 1,706 | 630 | 1,736 | 1,018 |
| 2012 | 1,764 | 582 | 1,016 | 1,151 | 1,790 | 883 | 1,125 | 1,244 | 582 | 365 | 470 | 528 |
| 2013 | 1,201 | 365 | ||||||||||
| 2014 | 415 | 251 | 372 | 373 | 506 | 276 | ||||||
| 2015 | 384 | 387 | 404 | |||||||||
| 2016 | 421 | 175 | 231 | 417 | ||||||||
| 2017 | 347 | 85 | ||||||||||
| 2018 | 147 | |||||||||||
| 2020 | 11 | |||||||||||
| 2021 | 126 | 613 | ||||||||||
| 2022 | 349 | |||||||||||
| 2023 | 473 | 525 | ||||||||||
| - = No Data Reported; -- = Not Applicable; NA = Not Available; W = Withheld to avoid disclosure of individual company data. |
| Release Date: 3/29/2024 |
| Next Release Date: 4/30/2024 |