|
Download Data (XLS File) |
|
||||||||
|
||||||||
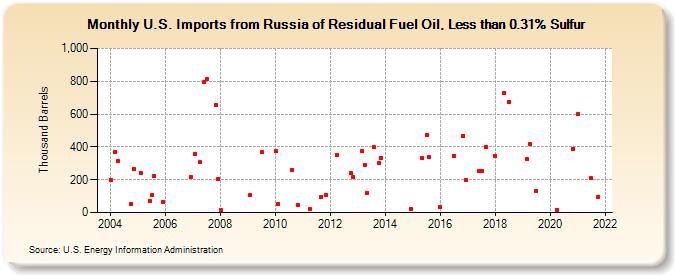
| U.S. Imports from Russia of Residual Fuel Oil, Less than 0.31% Sulfur (Thousand Barrels) | ||||||||
| Year | Jan | Feb | Mar | Apr | May | Jun | Jul | Aug | Sep | Oct | Nov | Dec |
|---|---|---|---|---|---|---|---|---|---|---|---|---|
| 2004 | 200 | 368 | 312 | 54 | 265 | |||||||
| 2005 | 240 | 69 | 104 | 222 | 63 | |||||||
| 2006 | 218 | |||||||||||
| 2007 | 357 | 306 | 795 | 811 | 656 | 207 | ||||||
| 2008 | 15 | |||||||||||
| 2009 | 108 | 367 | ||||||||||
| 2010 | 378 | 54 | 258 | 46 | ||||||||
| 2011 | 23 | 97 | 107 | |||||||||
| 2012 | 353 | 239 | 215 | |||||||||
| 2013 | 374 | 289 | 121 | 400 | 304 | 333 | ||||||
| 2014 | 22 | |||||||||||
| 2015 | 333 | 470 | 336 | |||||||||
| 2016 | 31 | 347 | 469 | 199 | ||||||||
| 2017 | 252 | 256 | 399 | |||||||||
| 2018 | 347 | 729 | 673 | |||||||||
| 2019 | 325 | 417 | 130 | |||||||||
| 2020 | 18 | 390 | ||||||||||
| 2021 | 599 | 208 | 96 | |||||||||
| - = No Data Reported; -- = Not Applicable; NA = Not Available; W = Withheld to avoid disclosure of individual company data. |
| Release Date: 6/28/2024 |
| Next Release Date: 7/31/2024 |