|
Download Data (XLS File) |
|
||||||||
|
||||||||
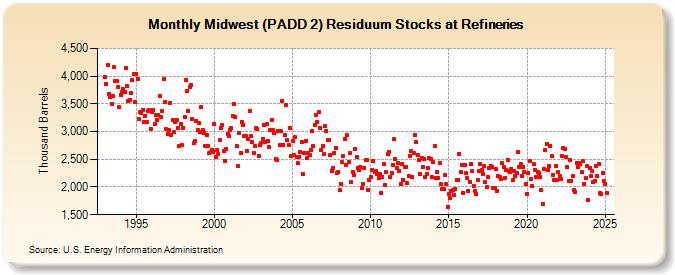
| Midwest (PADD 2) Residuum Stocks at Refineries (Thousand Barrels) | ||||||||
| Year | Jan | Feb | Mar | Apr | May | Jun | Jul | Aug | Sep | Oct | Nov | Dec |
|---|---|---|---|---|---|---|---|---|---|---|---|---|
| 1993 | 3,978 | 3,866 | 4,201 | 3,682 | 3,624 | 3,504 | 3,644 | 4,170 | 3,918 | 3,916 | 3,808 | 3,450 |
| 1994 | 3,666 | 3,720 | 3,766 | 3,716 | 4,150 | 3,822 | 3,551 | 3,575 | 3,692 | 3,926 | 4,045 | 3,542 |
| 1995 | 4,036 | 3,948 | 3,222 | 3,361 | 3,343 | 3,397 | 3,177 | 3,286 | 3,174 | 3,370 | 3,385 | 3,053 |
| 1996 | 3,354 | 3,392 | 3,140 | 3,290 | 3,203 | 3,294 | 3,641 | 3,255 | 3,364 | 3,950 | 3,527 | 3,050 |
| 1997 | 2,954 | 3,020 | 3,516 | 2,936 | 3,202 | 2,985 | 3,167 | 3,211 | 3,056 | 2,736 | 3,138 | 2,761 |
| 1998 | 3,060 | 3,265 | 3,927 | 3,732 | 3,372 | 3,809 | 3,834 | 3,232 | 2,794 | 2,822 | 3,197 | 3,035 |
| 1999 | 3,163 | 2,995 | 3,436 | 3,030 | 2,973 | 2,741 | 2,932 | 2,734 | 2,608 | 2,626 | 2,675 | 2,639 |
| 2000 | 3,140 | 2,542 | 2,663 | 2,592 | 2,848 | 3,073 | 3,117 | 2,646 | 2,468 | 2,692 | 2,957 | 2,928 |
| 2001 | 3,037 | 3,060 | 3,283 | 3,493 | 3,262 | 2,739 | 2,387 | 2,967 | 2,616 | 3,181 | 3,125 | 2,918 |
| 2002 | 2,924 | 2,641 | 2,871 | 3,374 | 2,924 | 2,816 | 2,622 | 2,745 | 3,060 | 3,045 | 2,552 | 2,752 |
| 2003 | 2,788 | 2,874 | 3,110 | 2,808 | 3,128 | 2,834 | 2,713 | 3,034 | 3,208 | 3,022 | 2,969 | 2,497 |
| 2004 | 2,486 | 3,010 | 2,757 | 3,007 | 3,556 | 2,765 | 2,936 | 3,479 | 2,841 | 2,760 | 3,062 | 2,557 |
| 2005 | 2,825 | 2,571 | 2,901 | 2,538 | 2,427 | 2,542 | 2,623 | 2,810 | 2,237 | 2,622 | 2,836 | 2,523 |
| 2006 | 2,605 | 2,577 | 2,665 | 3,001 | 2,735 | 3,127 | 3,305 | 3,174 | 3,351 | 3,072 | 2,670 | 2,745 |
| 2007 | 2,589 | 3,107 | 3,018 | 2,843 | 2,847 | 2,570 | 2,285 | 2,346 | 2,617 | 2,710 | 2,261 | 2,274 |
| 2008 | 1,941 | 2,058 | 2,446 | 2,565 | 2,866 | 2,399 | 2,933 | 2,449 | 2,617 | 2,099 | 2,271 | 2,218 |
| 2009 | 2,690 | 2,548 | 2,338 | 2,300 | 2,363 | 1,984 | 2,058 | 2,338 | 2,479 | 2,482 | 1,951 | 2,133 |
| 2010 | 2,177 | 2,314 | 2,471 | 2,276 | 2,282 | 2,233 | 2,165 | 2,238 | 1,895 | 2,188 | 2,410 | 2,027 |
| 2011 | 2,272 | 2,595 | 2,640 | 2,186 | 2,257 | 2,405 | 2,859 | 2,512 | 2,347 | 2,436 | 2,295 | 2,047 |
| 2012 | 2,415 | 2,133 | 2,358 | 2,369 | 2,069 | 2,207 | 2,564 | 2,644 | 2,182 | 2,606 | 2,929 | 2,817 |
| 2013 | 2,575 | 2,479 | 2,229 | 2,523 | 2,362 | 2,497 | 2,179 | 2,231 | 2,341 | 2,523 | 2,506 | 2,172 |
| 2014 | 2,451 | 2,734 | 2,161 | 2,266 | 2,166 | 2,436 | 2,058 | 1,955 | 1,955 | 2,209 | 2,051 | 1,648 |
| 2015 | 1,865 | 1,793 | 1,921 | 1,945 | 1,855 | 1,972 | 2,124 | 2,128 | 2,598 | 2,274 | 2,397 | 1,884 |
| 2016 | 2,405 | 2,245 | 2,165 | 1,935 | 2,098 | 2,406 | 2,283 | 2,020 | 1,928 | 1,871 | 2,119 | 2,293 |
| 2017 | 2,411 | 2,306 | 2,237 | 2,375 | 2,093 | 2,005 | 2,186 | 2,349 | 2,381 | 2,360 | 1,975 | 1,975 |
| 2018 | 2,331 | 1,928 | 2,196 | 2,183 | 2,142 | 2,427 | 2,364 | 2,159 | 2,310 | 2,479 | 2,297 | 2,276 |
| 2019 | 2,325 | 2,127 | 2,290 | 2,200 | 2,246 | 2,636 | 2,357 | 2,411 | 2,193 | 2,369 | 2,275 | 2,048 |
| 2020 | 1,875 | 2,246 | 2,465 | 2,137 | 2,010 | 2,406 | 2,313 | 2,176 | 2,265 | 2,253 | 2,184 | 1,946 |
| 2021 | 1,698 | 2,330 | 2,662 | 2,770 | 2,311 | 2,372 | 2,745 | 2,551 | 2,224 | 2,120 | 2,384 | 2,118 |
| 2022 | 2,269 | 2,194 | 2,140 | 2,563 | 2,706 | 2,682 | 2,542 | 2,354 | 2,111 | 2,493 | 2,113 | 2,193 |
| 2023 | 1,918 | 1,913 | 2,440 | 2,366 | 2,429 | 2,408 | 2,262 | 2,460 | 2,054 | 2,156 | 2,375 | 1,758 |
| 2024 | 2,348 | 2,195 | 2,287 | 2,091 | ||||||||
| - = No Data Reported; -- = Not Applicable; NA = Not Available; W = Withheld to avoid disclosure of individual company data. |
| Release Date: 6/28/2024 |
| Next Release Date: 7/31/2024 |