|
Download Data (XLS File) |
|
||||||||
|
||||||||
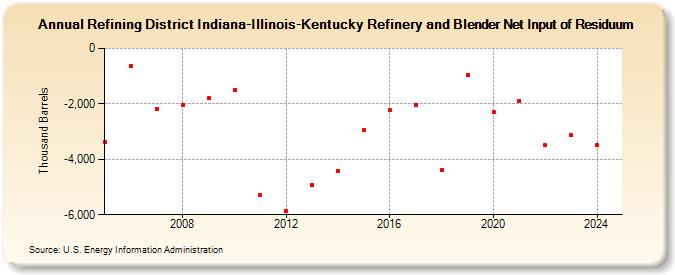
| Refining District Indiana-Illinois-Kentucky Refinery and Blender Net Input of Residuum (Thousand Barrels) | ||||||||
| Decade | Year-0 | Year-1 | Year-2 | Year-3 | Year-4 | Year-5 | Year-6 | Year-7 | Year-8 | Year-9 |
|---|---|---|---|---|---|---|---|---|---|---|
| 2000's | -3,387 | -637 | -2,171 | -2,042 | -1,793 | |||||
| 2010's | -1,489 | -5,305 | -5,871 | -4,941 | -4,406 | -2,939 | -2,232 | -2,058 | -4,375 | -954 |
| 2020's | -2,304 | -1,889 | -3,497 | -3,137 |
| - = No Data Reported; -- = Not Applicable; NA = Not Available; W = Withheld to avoid disclosure of individual company data. |
| Release Date: 6/28/2024 |
| Next Release Date: 8/30/2024 |