|
Download Data (XLS File) |
|
||||||||
|
||||||||
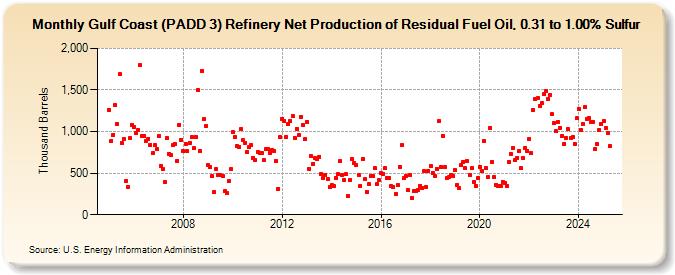
| Gulf Coast (PADD 3) Refinery Net Production of Residual Fuel Oil, 0.31 to 1.00% Sulfur (Thousand Barrels) | ||||||||
| Year | Jan | Feb | Mar | Apr | May | Jun | Jul | Aug | Sep | Oct | Nov | Dec |
|---|---|---|---|---|---|---|---|---|---|---|---|---|
| 2005 | 1,261 | 891 | 959 | 1,315 | 1,096 | 1,691 | 865 | 910 | 404 | 339 | 918 | 1,084 |
| 2006 | 1,057 | 985 | 1,024 | 1,798 | 949 | 951 | 889 | 914 | 844 | 742 | 835 | 793 |
| 2007 | 944 | 587 | 546 | 390 | 920 | 736 | 713 | 834 | 846 | 650 | 1,083 | 902 |
| 2008 | 763 | 855 | 762 | 865 | 934 | 799 | 940 | 1,497 | 764 | 1,732 | 1,153 | 1,072 |
| 2009 | 592 | 571 | 464 | 276 | 549 | 475 | 472 | 467 | 284 | 265 | 402 | 546 |
| 2010 | 991 | 935 | 828 | 820 | 1,033 | 894 | 867 | 752 | 813 | 836 | 687 | 655 |
| 2011 | 760 | 739 | 737 | 655 | 786 | 786 | 748 | 778 | 769 | 647 | 310 | 932 |
| 2012 | 1,154 | 1,128 | 936 | 1,086 | 1,127 | 1,192 | 924 | 1,036 | 957 | 1,181 | 1,080 | 906 |
| 2013 | 1,120 | 550 | 706 | 615 | 681 | 665 | 700 | 494 | 437 | 480 | 432 | 331 |
| 2014 | 354 | 344 | 441 | 485 | 644 | 479 | 417 | 485 | 224 | 416 | 665 | 624 |
| 2015 | 597 | 473 | 348 | 672 | 424 | 279 | 369 | 467 | 462 | 556 | 367 | 419 |
| 2016 | 505 | 493 | 558 | 436 | 444 | 345 | 333 | 248 | 355 | 579 | 836 | 437 |
| 2017 | 471 | 297 | 480 | 202 | 288 | 280 | 300 | 349 | 320 | 522 | 336 | 526 |
| 2018 | 583 | 505 | 471 | 555 | 1,122 | 572 | 951 | 572 | 438 | 449 | 482 | 464 |
| 2019 | 540 | 361 | 316 | 593 | 639 | 557 | 643 | 482 | 556 | 395 | 347 | 443 |
| 2020 | 577 | 520 | 887 | 559 | 456 | 1,047 | 632 | 452 | 363 | 341 | 348 | 395 |
| 2021 | 385 | 347 | 633 | 731 | 800 | 653 | 687 | 765 | 556 | 679 | 806 | 767 |
| 2022 | 913 | 737 | 1,264 | 1,396 | 1,400 | 1,311 | 1,346 | 1,446 | 1,488 | 1,390 | 1,445 | 1,208 |
| 2023 | 1,102 | 1,003 | 1,120 | 1,048 | 952 | 854 | 921 | 1,026 | 921 | 936 | 856 | 1,159 |
| 2024 | 1,272 | 1,018 | 1,096 | 1,293 | ||||||||
| - = No Data Reported; -- = Not Applicable; NA = Not Available; W = Withheld to avoid disclosure of individual company data. |
| Release Date: 6/28/2024 |
| Next Release Date: 7/31/2024 |