|
Download Data (XLS File) |
|
||||||||
|
||||||||
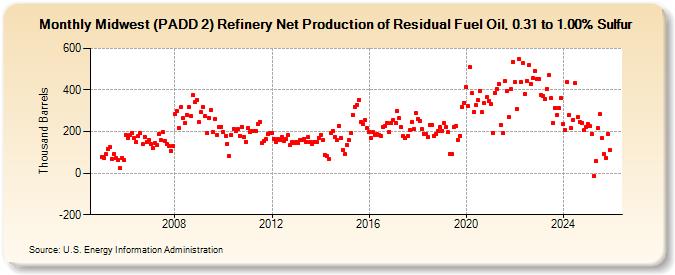
| Midwest (PADD 2) Refinery Net Production of Residual Fuel Oil, 0.31 to 1.00% Sulfur (Thousand Barrels) | ||||||||
| Year | Jan | Feb | Mar | Apr | May | Jun | Jul | Aug | Sep | Oct | Nov | Dec |
|---|---|---|---|---|---|---|---|---|---|---|---|---|
| 2005 | 80 | 74 | 90 | 115 | 124 | 69 | 93 | 72 | 62 | 23 | 75 | 61 |
| 2006 | 183 | 171 | 184 | 195 | 169 | 148 | 178 | 191 | 138 | 175 | 152 | 157 |
| 2007 | 139 | 121 | 143 | 134 | 186 | 158 | 197 | 154 | 142 | 130 | 106 | 132 |
| 2008 | 284 | 300 | 216 | 317 | 265 | 241 | 281 | 317 | 274 | 374 | 340 | 352 |
| 2009 | 244 | 293 | 320 | 274 | 195 | 267 | 302 | 196 | 261 | 185 | 224 | 224 |
| 2010 | 199 | 181 | 142 | 82 | 183 | 214 | 204 | 210 | 179 | 224 | 174 | 152 |
| 2011 | 215 | 197 | 205 | 204 | 201 | 234 | 246 | 144 | 154 | 164 | 186 | 193 |
| 2012 | 195 | 166 | 151 | 162 | 159 | 172 | 155 | 164 | 183 | 134 | 151 | 144 |
| 2013 | 151 | 143 | 159 | 160 | 166 | 151 | 173 | 152 | 141 | 151 | 150 | 171 |
| 2014 | 185 | 159 | 89 | 81 | 70 | 194 | 205 | 176 | 158 | 228 | 168 | 112 |
| 2015 | 90 | 137 | 158 | 194 | 282 | 319 | 329 | 353 | 246 | 235 | 257 | 216 |
| 2016 | 200 | 168 | 196 | 184 | 186 | 184 | 177 | 223 | 228 | 243 | 199 | 241 |
| 2017 | 255 | 240 | 300 | 263 | 220 | 177 | 168 | 178 | 206 | 245 | 213 | 288 |
| 2018 | 260 | 253 | 210 | 190 | 187 | 175 | 231 | 232 | 181 | 188 | 202 | 221 |
| 2019 | 203 | 239 | 224 | 196 | 91 | 91 | 222 | 226 | 158 | 180 | 317 | 339 |
| 2020 | 413 | 322 | 510 | 384 | 296 | 327 | 351 | 397 | 292 | 336 | 364 | 349 |
| 2021 | 333 | 195 | 387 | 405 | 429 | 233 | 192 | 441 | 393 | 269 | 403 | 536 |
| 2022 | 439 | 309 | 549 | 439 | 531 | 380 | 445 | 519 | 430 | 457 | 492 | 454 |
| 2023 | 451 | 376 | 372 | 355 | 404 | 470 | 359 | 240 | 315 | 280 | 311 | 360 |
| 2024 | 236 | 206 | 437 | 279 | ||||||||
| - = No Data Reported; -- = Not Applicable; NA = Not Available; W = Withheld to avoid disclosure of individual company data. |
| Release Date: 6/28/2024 |
| Next Release Date: 7/31/2024 |