|
Download Data (XLS File) |
|
||||||||
|
||||||||
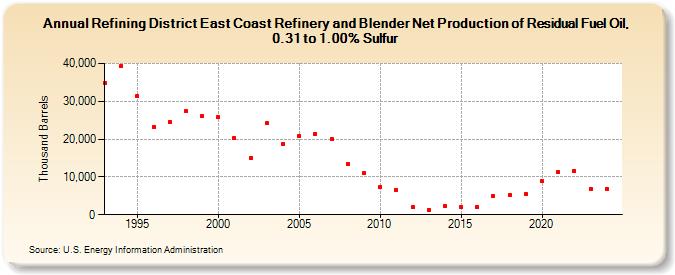
| Refining District East Coast Refinery and Blender Net Production of Residual Fuel Oil, 0.31 to 1.00% Sulfur (Thousand Barrels) | ||||||||
| Decade | Year-0 | Year-1 | Year-2 | Year-3 | Year-4 | Year-5 | Year-6 | Year-7 | Year-8 | Year-9 |
|---|---|---|---|---|---|---|---|---|---|---|
| 1990's | 34,714 | 39,314 | 31,341 | 23,262 | 24,621 | 27,427 | 26,031 | |||
| 2000's | 25,763 | 20,309 | 15,129 | 24,232 | 18,768 | 20,878 | 21,397 | 20,143 | 13,404 | 10,904 |
| 2010's | 7,352 | 6,665 | 1,966 | 1,341 | 2,180 | 2,086 | 1,974 | 4,958 | 5,218 | 5,517 |
| 2020's | 8,891 | 11,293 | 11,606 | 6,818 |
| - = No Data Reported; -- = Not Applicable; NA = Not Available; W = Withheld to avoid disclosure of individual company data. |
| Release Date: 3/29/2024 |
| Next Release Date: 8/30/2024 |