|
Download Data (XLS File) |
|
||||||||
|
||||||||
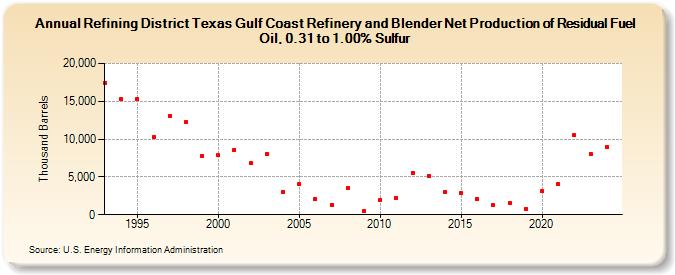
| Refining District Texas Gulf Coast Refinery and Blender Net Production of Residual Fuel Oil, 0.31 to 1.00% Sulfur (Thousand Barrels) | ||||||||
| Decade | Year-0 | Year-1 | Year-2 | Year-3 | Year-4 | Year-5 | Year-6 | Year-7 | Year-8 | Year-9 |
|---|---|---|---|---|---|---|---|---|---|---|
| 1990's | 17,429 | 15,329 | 15,241 | 10,258 | 13,092 | 12,259 | 7,807 | |||
| 2000's | 7,851 | 8,575 | 6,826 | 8,017 | 3,025 | 4,032 | 2,042 | 1,333 | 3,587 | 485 |
| 2010's | 1,959 | 2,246 | 5,551 | 5,126 | 3,058 | 2,881 | 2,059 | 1,231 | 1,596 | 811 |
| 2020's | 3,076 | 4,038 | 10,494 | 8,022 | 8,948 |
| - = No Data Reported; -- = Not Applicable; NA = Not Available; W = Withheld to avoid disclosure of individual company data. |
| Release Date: 6/30/2025 |
| Next Release Date: 8/29/2025 |