|
Download Data (XLS File) |
|
||||||||
|
||||||||
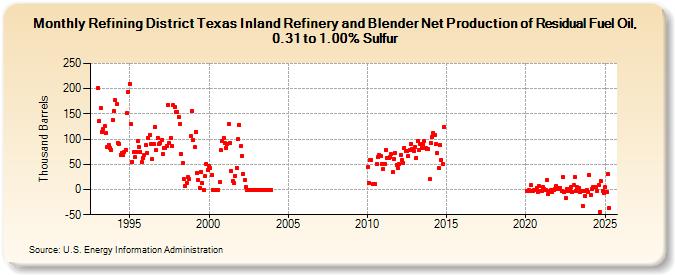
| Refining District Texas Inland Refinery and Blender Net Production of Residual Fuel Oil, 0.31 to 1.00% Sulfur (Thousand Barrels) | ||||||||
| Year | Jan | Feb | Mar | Apr | May | Jun | Jul | Aug | Sep | Oct | Nov | Dec |
|---|---|---|---|---|---|---|---|---|---|---|---|---|
| 1993 | 201 | 135 | 161 | 115 | 120 | 125 | 113 | 85 | 88 | 83 | 79 | 138 |
| 1994 | 155 | 177 | 169 | 93 | 91 | 69 | 73 | 68 | 74 | 79 | 151 | 194 |
| 1995 | 210 | 129 | 55 | 74 | 64 | 75 | 96 | 85 | 75 | 54 | 63 | 68 |
| 1996 | 88 | 73 | 102 | 109 | 90 | 60 | 90 | 124 | 78 | 103 | 90 | 92 |
| 1997 | 98 | 70 | 83 | 82 | 87 | 168 | 92 | 103 | 87 | 167 | 164 | 153 |
| 1998 | 154 | 144 | 129 | 71 | 52 | 20 | 6 | 13 | 24 | 20 | 106 | 155 |
| 1999 | 99 | 84 | 115 | 33 | 18 | 3 | 35 | 12 | 0 | 26 | 51 | 39 |
| 2000 | 47 | 42 | 28 | 0 | 0 | 0 | 0 | 0 | 15 | 78 | 97 | 102 |
| 2001 | 92 | 83 | 91 | 129 | 93 | 36 | 16 | 12 | 27 | 43 | 100 | 128 |
| 2002 | 86 | 67 | 31 | 19 | 5 | 0 | 0 | 0 | 0 | 0 | 0 | 0 |
| 2003 | 0 | 0 | 0 | 0 | 0 | 0 | 0 | 0 | 0 | 0 | 0 | 0 |
| 2010 | 45 | 13 | 58 | 59 | 10 | 11 | 51 | 64 | 68 | 66 | 51 | |
| 2011 | 41 | 50 | 79 | 63 | 62 | 65 | 70 | 34 | 61 | 73 | 49 | 43 |
| 2012 | 50 | 68 | 59 | 53 | 83 | 77 | 76 | 66 | 79 | 91 | 80 | 76 |
| 2013 | 84 | 63 | 96 | 78 | 91 | 82 | 90 | 96 | 83 | 81 | 81 | 20 |
| 2014 | 92 | 105 | 113 | 109 | 90 | 72 | 43 | 88 | 59 | 51 | 124 | |
| 2020 | -3 | -1 | -2 | 8 | -2 | -1 | -1 | 3 | -5 | 6 | -3 | |
| 2021 | -3 | 4 | 1 | -1 | 19 | -8 | -3 | -1 | -4 | -1 | 2 | 7 |
| 2022 | 3 | 2 | 3 | -3 | 24 | -4 | -17 | 1 | -3 | 1 | 4 | -4 |
| 2023 | 8 | 25 | -2 | 4 | 3 | -5 | -2 | -32 | -2 | -12 | -1 | -4 |
| 2024 | 29 | -10 | 2 | 4 | 5 | |||||||
| - = No Data Reported; -- = Not Applicable; NA = Not Available; W = Withheld to avoid disclosure of individual company data. |
| Release Date: 8/30/2024 |
| Next Release Date: 9/30/2024 |