|
Download Data (XLS File) |
|
||||||||
|
||||||||
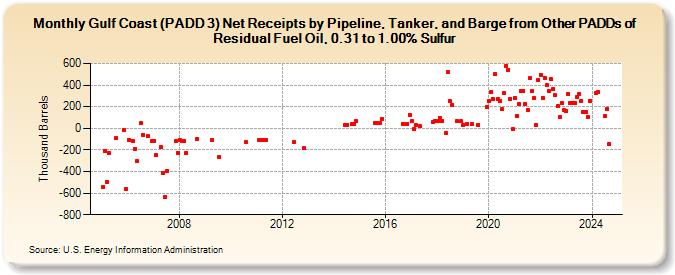
| Gulf Coast (PADD 3) Net Receipts by Pipeline, Tanker, and Barge from Other PADDs of Residual Fuel Oil, 0.31 to 1.00% Sulfur (Thousand Barrels) | ||||||||
| Year | Jan | Feb | Mar | Apr | May | Jun | Jul | Aug | Sep | Oct | Nov | Dec |
|---|---|---|---|---|---|---|---|---|---|---|---|---|
| 2005 | -540 | -210 | -497 | -228 | -93 | -16 | -562 | |||||
| 2006 | -106 | -115 | -193 | -306 | 48 | -58 | -75 | -115 | ||||
| 2007 | -114 | -246 | -170 | -410 | -637 | -395 | -113 | -226 | ||||
| 2008 | -108 | -116 | -114 | -228 | -95 | |||||||
| 2009 | -112 | -268 | ||||||||||
| 2010 | -130 | |||||||||||
| 2011 | -110 | -110 | -110 | -110 | ||||||||
| 2012 | -126 | -187 | ||||||||||
| 2014 | 35 | 35 | 36 | 37 | 66 | |||||||
| 2015 | 51 | 51 | 51 | 85 | ||||||||
| 2016 | 39 | 40 | 126 | |||||||||
| 2017 | 69 | -7 | 33 | 17 | 62 | 64 | ||||||
| 2018 | 64 | 98 | 64 | -43 | 518 | 251 | 214 | 65 | 65 | |||
| 2019 | 35 | 40 | 40 | 34 | 196 | |||||||
| 2020 | 249 | 340 | 271 | 502 | 271 | 250 | 178 | 330 | 581 | 542 | 274 | -6 |
| 2021 | 285 | 114 | 229 | 345 | 348 | 227 | 173 | 463 | 345 | 279 | 31 | 449 |
| 2022 | 496 | 281 | 467 | 402 | 347 | 454 | 365 | 304 | 206 | 106 | 234 | 167 |
| 2023 | 158 | 314 | 238 | 236 | 233 | 292 | 319 | 254 | 153 | 153 | 107 | 256 |
| 2024 | 323 | 338 | ||||||||||
| - = No Data Reported; -- = Not Applicable; NA = Not Available; W = Withheld to avoid disclosure of individual company data. |
| Release Date: 6/28/2024 |
| Next Release Date: 7/31/2024 |