|
Download Data (XLS File) |
|
||||||||
|
||||||||
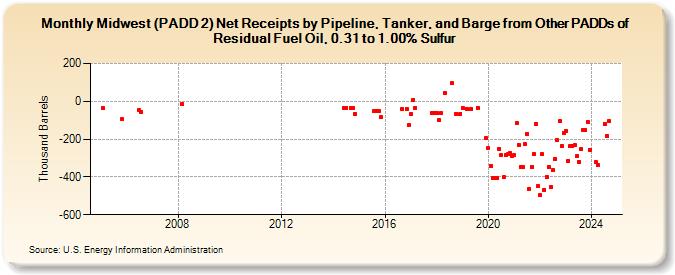
| Midwest (PADD 2) Net Receipts by Pipeline, Tanker, and Barge from Other PADDs of Residual Fuel Oil, 0.31 to 1.00% Sulfur (Thousand Barrels) | ||||||||
| Year | Jan | Feb | Mar | Apr | May | Jun | Jul | Aug | Sep | Oct | Nov | Dec |
|---|---|---|---|---|---|---|---|---|---|---|---|---|
| 2005 | -38 | -96 | ||||||||||
| 2006 | -48 | -56 | ||||||||||
| 2008 | -15 | |||||||||||
| 2014 | -35 | -35 | -36 | -37 | -66 | |||||||
| 2015 | -51 | -51 | -51 | -85 | ||||||||
| 2016 | -39 | -40 | -126 | |||||||||
| 2017 | -69 | 7 | -33 | -62 | -64 | |||||||
| 2018 | -64 | -98 | -64 | 43 | 95 | -65 | -65 | |||||
| 2019 | -35 | -40 | -40 | -34 | -196 | |||||||
| 2020 | -249 | -340 | -406 | -405 | -404 | -250 | -285 | -402 | -284 | -281 | -274 | -289 |
| 2021 | -285 | -114 | -229 | -345 | -348 | -227 | -173 | -463 | -345 | -279 | -118 | -449 |
| 2022 | -496 | -281 | -467 | -402 | -347 | -454 | -365 | -304 | -206 | -106 | -234 | -167 |
| 2023 | -158 | -314 | -238 | -236 | -233 | -292 | -319 | -254 | -153 | -153 | -107 | -256 |
| - = No Data Reported; -- = Not Applicable; NA = Not Available; W = Withheld to avoid disclosure of individual company data. |
| Release Date: 3/29/2024 |
| Next Release Date: 4/30/2024 |