|
Download Data (XLS File) |
|
||||||||
|
||||||||
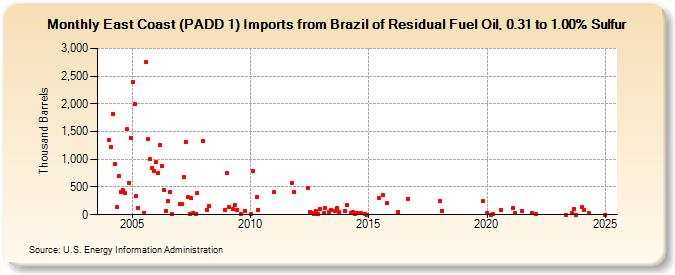
| East Coast (PADD 1) Imports from Brazil of Residual Fuel Oil, 0.31 to 1.00% Sulfur (Thousand Barrels) | ||||||||
| Year | Jan | Feb | Mar | Apr | May | Jun | Jul | Aug | Sep | Oct | Nov | Dec |
|---|---|---|---|---|---|---|---|---|---|---|---|---|
| 2004 | 1,349 | 1,228 | 1,818 | 912 | 145 | 697 | 411 | 449 | 393 | 1,538 | 568 | 1,381 |
| 2005 | 2,390 | 2,001 | 336 | 128 | 23 | 2,746 | 1,370 | 1,000 | 839 | 793 | ||
| 2006 | 949 | 745 | 1,256 | 876 | 446 | 68 | 256 | 412 | 14 | |||
| 2007 | 199 | 199 | 685 | 1,317 | 328 | 13 | 309 | 31 | 19 | 393 | ||
| 2008 | 1,333 | 89 | 154 | 92 | ||||||||
| 2009 | 756 | 136 | 104 | 174 | 93 | 10 | 73 | |||||
| 2010 | 8 | 793 | 311 | 78 | ||||||||
| 2011 | 408 | 574 | 411 | |||||||||
| 2012 | 476 | 50 | 31 | 16 | 68 | 19 | 110 | |||||
| 2013 | 30 | 125 | 47 | 88 | 75 | 113 | 41 | |||||
| 2014 | 76 | 174 | 37 | 51 | 11 | 39 | 35 | 6 | 1 | |||
| 2015 | 310 | 354 | 208 | |||||||||
| 2016 | 56 | 292 | ||||||||||
| 2018 | 240 | 75 | ||||||||||
| 2019 | 239 | |||||||||||
| 2020 | 37 | 2 | 6 | 79 | ||||||||
| 2021 | 128 | 23 | 65 | 27 | ||||||||
| 2022 | 4 | |||||||||||
| 2023 | 2 | 25 | 100 | 3 | ||||||||
| 2024 | 140 | |||||||||||
| - = No Data Reported; -- = Not Applicable; NA = Not Available; W = Withheld to avoid disclosure of individual company data. |
| Release Date: 3/29/2024 |
| Next Release Date: 4/30/2024 |