|
Download Data (XLS File) |
|
||||||||
|
||||||||
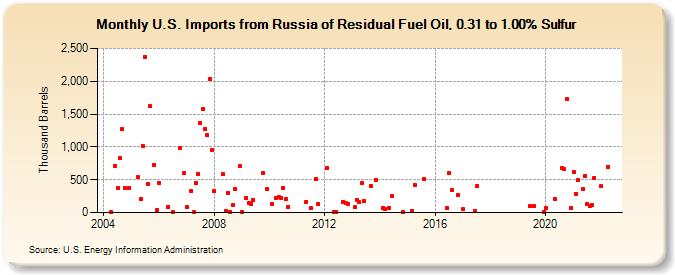
| U.S. Imports from Russia of Residual Fuel Oil, 0.31 to 1.00% Sulfur (Thousand Barrels) | ||||||||
| Year | Jan | Feb | Mar | Apr | May | Jun | Jul | Aug | Sep | Oct | Nov | Dec |
|---|---|---|---|---|---|---|---|---|---|---|---|---|
| 2004 | 12 | 715 | 375 | 825 | 1,274 | 379 | 371 | |||||
| 2005 | 541 | 202 | 1,019 | 2,375 | 440 | 1,619 | 717 | 46 | ||||
| 2006 | 455 | 90 | 8 | 977 | 603 | |||||||
| 2007 | 91 | 331 | 2 | 454 | 588 | 1,367 | 1,579 | 1,271 | 1,177 | 2,033 | 952 | |
| 2008 | 322 | 581 | 24 | 305 | 11 | 112 | 355 | 703 | ||||
| 2009 | 15 | 228 | 140 | 135 | 194 | 608 | 356 | |||||
| 2010 | 136 | 227 | 230 | 215 | 377 | 213 | 87 | |||||
| 2011 | 167 | 66 | 509 | 132 | ||||||||
| 2012 | 682 | 9 | 4 | 165 | 151 | 134 | ||||||
| 2013 | 81 | 191 | 155 | 446 | 172 | 406 | 490 | |||||
| 2014 | 62 | 55 | 73 | 246 | 12 | |||||||
| 2015 | 31 | 417 | 516 | |||||||||
| 2016 | 64 | 602 | 342 | 266 | ||||||||
| 2017 | 49 | 22 | 411 | |||||||||
| 2019 | 99 | 100 | 1 | |||||||||
| 2020 | 68 | 210 | 684 | 670 | 1,728 | 65 | ||||||
| 2021 | 614 | 285 | 499 | 353 | 560 | 134 | 102 | 111 | 524 | |||
| 2022 | 400 | 697 | ||||||||||
| - = No Data Reported; -- = Not Applicable; NA = Not Available; W = Withheld to avoid disclosure of individual company data. |
| Release Date: 6/28/2024 |
| Next Release Date: 7/31/2024 |