|
Download Data (XLS File) |
|
||||||||
|
||||||||
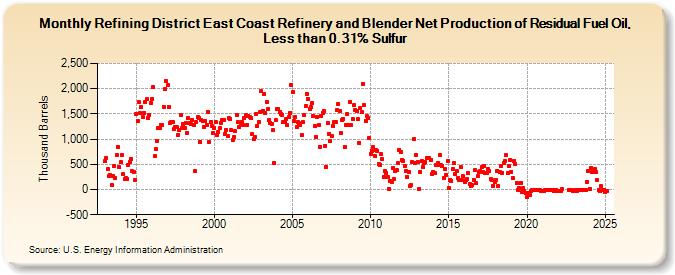
| Refining District East Coast Refinery and Blender Net Production of Residual Fuel Oil, Less than 0.31% Sulfur (Thousand Barrels) | ||||||||
| Year | Jan | Feb | Mar | Apr | May | Jun | Jul | Aug | Sep | Oct | Nov | Dec |
|---|---|---|---|---|---|---|---|---|---|---|---|---|
| 1993 | 559 | 625 | 403 | 270 | 282 | 87 | 272 | 475 | 227 | 685 | 845 | 438 |
| 1994 | 541 | 689 | 299 | 201 | 228 | 215 | 493 | 552 | 613 | 361 | 354 | 187 |
| 1995 | 1,506 | 1,366 | 1,732 | 1,512 | 1,631 | 1,434 | 1,524 | 1,737 | 1,786 | 1,422 | 1,482 | 1,720 |
| 1996 | 1,801 | 2,024 | 669 | 799 | 971 | 1,214 | 1,213 | 1,289 | 1,282 | 1,638 | 1,991 | 2,151 |
| 1997 | 2,064 | 1,645 | 1,320 | 1,349 | 1,330 | 1,210 | 1,248 | 1,242 | 1,087 | 1,181 | 1,481 | 1,226 |
| 1998 | 1,296 | 1,217 | 1,323 | 1,129 | 1,422 | 1,317 | 1,297 | 1,381 | 1,280 | 366 | 1,335 | 1,435 |
| 1999 | 1,419 | 946 | 1,370 | 1,360 | 1,245 | 1,361 | 1,275 | 1,545 | 949 | 1,347 | 1,257 | 1,114 |
| 2000 | 1,227 | 1,340 | 1,078 | 1,146 | 1,218 | 1,327 | 1,376 | 1,382 | 1,101 | 1,188 | 1,061 | 1,409 |
| 2001 | 1,399 | 1,172 | 974 | 1,033 | 1,153 | 1,483 | 1,333 | 1,242 | 1,321 | 1,345 | 1,270 | 1,411 |
| 2002 | 1,471 | 1,286 | 1,454 | 1,443 | 1,413 | 1,100 | 993 | 1,037 | 1,507 | 1,261 | 1,348 | 1,532 |
| 2003 | 1,949 | 1,566 | 1,903 | 1,525 | 1,727 | 1,596 | 1,388 | 1,322 | 1,302 | 1,173 | 528 | 1,369 |
| 2004 | 1,591 | 1,594 | 1,533 | 1,498 | 1,486 | 1,342 | 1,334 | 1,407 | 1,276 | 1,434 | 1,524 | 2,072 |
| 2005 | 1,927 | 1,359 | 1,430 | 1,240 | 1,338 | 1,313 | 1,284 | 1,080 | 1,333 | 1,473 | 1,660 | 1,893 |
| 2006 | 1,792 | 1,593 | 1,628 | 1,707 | 1,458 | 1,265 | 1,041 | 1,443 | 1,280 | 848 | 1,461 | 1,523 |
| 2007 | 1,550 | 873 | 444 | 1,320 | 1,108 | 956 | 1,060 | 1,265 | 1,348 | 1,334 | 1,571 | 1,697 |
| 2008 | 1,556 | 1,119 | 1,370 | 1,394 | 847 | 1,272 | 1,495 | 1,289 | 1,744 | 1,282 | 1,396 | 1,670 |
| 2009 | 1,585 | 1,549 | 1,392 | 928 | 1,610 | 1,532 | 2,101 | 1,677 | 1,366 | 1,452 | 1,413 | 1,016 |
| 2010 | 709 | 765 | 847 | 671 | 775 | 773 | 498 | 489 | 698 | 600 | 255 | 369 |
| 2011 | 336 | 257 | 16 | 169 | 155 | 428 | 203 | 371 | 386 | 518 | 790 | 744 |
| 2012 | 593 | 574 | 474 | 370 | 255 | 349 | 61 | 90 | 549 | 999 | 532 | 694 |
| 2013 | 553 | 12 | 357 | 565 | 450 | 535 | 543 | 625 | 618 | 628 | 594 | 299 |
| 2014 | 344 | 327 | 483 | 479 | 524 | 690 | 481 | 472 | 233 | 405 | 297 | 559 |
| 2015 | 34 | 198 | 172 | 408 | 516 | 313 | 368 | 234 | 186 | 449 | 180 | 259 |
| 2016 | 158 | 179 | 207 | 319 | 108 | 75 | 84 | 195 | 384 | 125 | 262 | 351 |
| 2017 | 371 | 444 | 340 | 465 | 337 | 325 | 402 | 360 | 211 | 183 | 77 | 153 |
| 2018 | 195 | 373 | 73 | 342 | 471 | 337 | 518 | 560 | 678 | 318 | 463 | 595 |
| 2019 | 356 | 235 | 572 | 498 | 134 | -7 | 34 | 126 | -52 | 23 | -36 | -75 |
| 2020 | -149 | -72 | -109 | -35 | -18 | -6 | -1 | -4 | -9 | -6 | -17 | -30 |
| 2021 | -39 | -35 | -13 | -19 | -6 | -4 | -4 | -7 | -20 | -12 | -22 | |
| 2022 | -30 | -34 | -22 | 8 | 0 | -7 | -14 | -25 | ||||
| 2023 | -28 | -16 | -30 | -7 | -5 | -5 | -8 | 0 | 157 | 365 | ||
| 2024 | 18 | |||||||||||
| - = No Data Reported; -- = Not Applicable; NA = Not Available; W = Withheld to avoid disclosure of individual company data. |
| Release Date: 3/29/2024 |
| Next Release Date: 4/30/2024 |