|
Download Data (XLS File) |
|
||||||||
|
||||||||
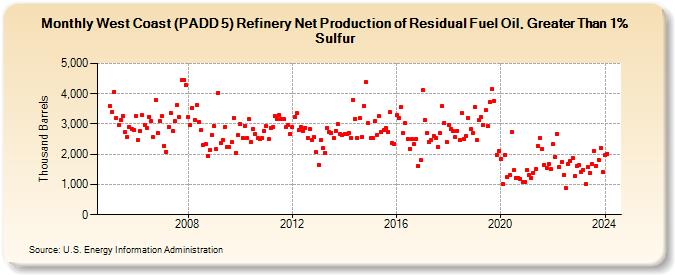
| West Coast (PADD 5) Refinery Net Production of Residual Fuel Oil, Greater Than 1% Sulfur (Thousand Barrels) | ||||||||
| Year | Jan | Feb | Mar | Apr | May | Jun | Jul | Aug | Sep | Oct | Nov | Dec |
|---|---|---|---|---|---|---|---|---|---|---|---|---|
| 2005 | 3,597 | 3,402 | 4,068 | 3,204 | 2,964 | 3,140 | 3,269 | 2,728 | 2,565 | 2,906 | 2,846 | 2,803 |
| 2006 | 3,261 | 2,454 | 2,769 | 3,282 | 2,971 | 2,859 | 3,242 | 3,090 | 2,553 | 3,787 | 2,710 | 3,084 |
| 2007 | 3,252 | 2,274 | 2,083 | 2,907 | 3,369 | 2,779 | 3,087 | 3,635 | 3,219 | 4,439 | 4,439 | 4,284 |
| 2008 | 3,221 | 2,957 | 3,544 | 3,138 | 3,613 | 3,078 | 2,789 | 2,310 | 2,346 | 1,949 | 2,140 | 2,630 |
| 2009 | 2,922 | 2,164 | 4,029 | 2,370 | 2,469 | 2,896 | 2,227 | 2,248 | 2,389 | 3,208 | 2,056 | 2,625 |
| 2010 | 2,995 | 2,526 | 2,942 | 2,531 | 3,151 | 2,420 | 2,841 | 2,664 | 2,538 | 2,501 | 2,521 | 2,772 |
| 2011 | 2,921 | 2,494 | 2,881 | 2,888 | 3,262 | 3,159 | 3,291 | 3,150 | 3,150 | 2,899 | 2,977 | 2,677 |
| 2012 | 2,893 | 3,223 | 3,349 | 2,806 | 2,901 | 2,784 | 2,875 | 2,547 | 2,820 | 2,454 | 2,567 | 2,069 |
| 2013 | 1,660 | 2,465 | 2,199 | 2,055 | 2,880 | 2,723 | 2,702 | 2,543 | 2,777 | 2,989 | 2,680 | 2,641 |
| 2014 | 2,662 | 2,659 | 2,717 | 2,542 | 3,808 | 3,171 | 2,530 | 3,187 | 2,572 | 3,591 | 4,374 | 3,022 |
| 2015 | 2,520 | 2,551 | 3,090 | 2,638 | 3,257 | 2,723 | 2,791 | 2,859 | 2,748 | 3,381 | 2,377 | 2,351 |
| 2016 | 3,286 | 3,199 | 3,563 | 2,686 | 3,020 | 2,499 | 2,174 | 2,497 | 2,334 | 2,499 | 1,616 | 1,806 |
| 2017 | 4,109 | 3,129 | 2,689 | 2,400 | 2,474 | 2,597 | 2,546 | 2,253 | 2,689 | 3,581 | 3,048 | 2,407 |
| 2018 | 2,974 | 2,840 | 2,761 | 2,574 | 2,781 | 2,463 | 3,367 | 2,489 | 2,603 | 3,211 | 2,823 | 2,696 |
| 2019 | 3,563 | 2,473 | 3,118 | 3,223 | 2,959 | 3,451 | 2,939 | 3,712 | 4,153 | 3,772 | 1,986 | 2,108 |
| 2020 | 1,852 | 1,022 | 1,984 | 1,248 | 1,301 | 2,734 | 1,466 | 1,228 | 1,219 | 1,191 | 1,090 | 1,075 |
| 2021 | 1,489 | 1,319 | 1,230 | 1,395 | 1,509 | 2,282 | 2,537 | 2,185 | 1,659 | 1,545 | 1,675 | 1,502 |
| 2022 | 2,329 | 1,909 | 2,670 | 1,578 | 1,751 | 1,323 | 874 | 1,687 | 1,789 | 1,874 | 1,275 | 1,615 |
| 2023 | 1,631 | 1,415 | 1,494 | 1,013 | 1,570 | 1,381 | 1,664 | 2,107 | 1,627 | 1,813 | 2,217 | 1,406 |
| 2024 | 1,959 | |||||||||||
| - = No Data Reported; -- = Not Applicable; NA = Not Available; W = Withheld to avoid disclosure of individual company data. |
| Release Date: 3/29/2024 |
| Next Release Date: 4/30/2024 |