|
Download Data (XLS File) |
|
||||||||
|
||||||||
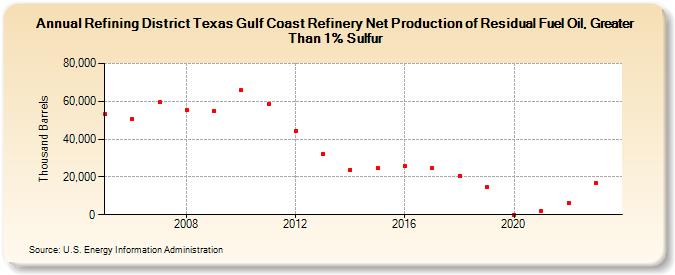
| Refining District Texas Gulf Coast Refinery Net Production of Residual Fuel Oil, Greater Than 1% Sulfur (Thousand Barrels) | ||||||||
| Decade | Year-0 | Year-1 | Year-2 | Year-3 | Year-4 | Year-5 | Year-6 | Year-7 | Year-8 | Year-9 |
|---|---|---|---|---|---|---|---|---|---|---|
| 2000's | 53,074 | 50,756 | 59,388 | 55,440 | 55,059 | |||||
| 2010's | 65,793 | 58,630 | 44,455 | 32,265 | 23,828 | 24,956 | 25,730 | 24,507 | 20,680 | 14,508 |
| 2020's | 98 | 2,111 | 6,224 | 16,863 | 23,912 |
| - = No Data Reported; -- = Not Applicable; NA = Not Available; W = Withheld to avoid disclosure of individual company data. |
| Release Date: 6/30/2025 |
| Next Release Date: 8/29/2025 |