|
Download Data (XLS File) |
|
||||||||
|
||||||||
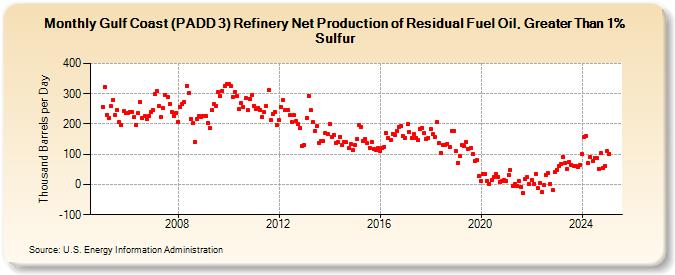
| Gulf Coast (PADD 3) Refinery Net Production of Residual Fuel Oil, Greater Than 1% Sulfur (Thousand Barrels per Day) | ||||||||
| Year | Jan | Feb | Mar | Apr | May | Jun | Jul | Aug | Sep | Oct | Nov | Dec |
|---|---|---|---|---|---|---|---|---|---|---|---|---|
| 2005 | 257 | 323 | 230 | 221 | 258 | 279 | 230 | 247 | 206 | 198 | 242 | 235 |
| 2006 | 237 | 240 | 240 | 222 | 198 | 236 | 272 | 219 | 225 | 215 | 228 | 238 |
| 2007 | 245 | 299 | 308 | 259 | 222 | 253 | 297 | 290 | 267 | 239 | 228 | 236 |
| 2008 | 208 | 257 | 265 | 272 | 327 | 304 | 218 | 202 | 140 | 216 | 228 | 223 |
| 2009 | 227 | 225 | 203 | 186 | 245 | 266 | 261 | 306 | 293 | 310 | 327 | 331 |
| 2010 | 333 | 325 | 289 | 307 | 293 | 248 | 270 | 256 | 285 | 245 | 284 | 296 |
| 2011 | 261 | 250 | 252 | 247 | 222 | 238 | 258 | 311 | 212 | 233 | 241 | 197 |
| 2012 | 212 | 255 | 279 | 246 | 246 | 229 | 206 | 229 | 211 | 200 | 187 | 127 |
| 2013 | 130 | 220 | 294 | 245 | 206 | 178 | 192 | 138 | 144 | 145 | 170 | 166 |
| 2014 | 201 | 157 | 165 | 137 | 140 | 158 | 129 | 140 | 139 | 120 | 133 | 115 |
| 2015 | 130 | 150 | 197 | 190 | 145 | 150 | 137 | 122 | 142 | 116 | 114 | 120 |
| 2016 | 112 | 122 | 124 | 170 | 152 | 147 | 168 | 164 | 178 | 191 | 193 | 161 |
| 2017 | 155 | 199 | 174 | 155 | 166 | 155 | 147 | 185 | 188 | 169 | 149 | 155 |
| 2018 | 182 | 166 | 156 | 206 | 136 | 105 | 129 | 129 | 135 | 123 | 178 | 178 |
| 2019 | 109 | 72 | 94 | 131 | 126 | 140 | 118 | 120 | 100 | 76 | 82 | 27 |
| 2020 | 11 | 33 | 36 | 11 | 3 | 15 | 24 | 34 | 26 | 9 | 12 | 15 |
| 2021 | 12 | 30 | 48 | -4 | 2 | -4 | 10 | -7 | -29 | 19 | 24 | 0 |
| 2022 | 16 | 3 | 36 | -13 | 4 | -26 | -2 | 32 | 37 | 1 | -19 | 41 |
| 2023 | 49 | 60 | 68 | 90 | 71 | 51 | 75 | 65 | 62 | 60 | 57 | 64 |
| 2024 | 100 | |||||||||||
| - = No Data Reported; -- = Not Applicable; NA = Not Available; W = Withheld to avoid disclosure of individual company data. |
| Release Date: 3/29/2024 |
| Next Release Date: 4/30/2024 |