|
Download Data (XLS File) |
|
||||||||
|
||||||||
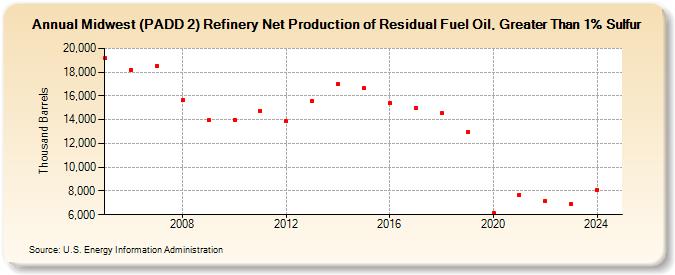
| Midwest (PADD 2) Refinery Net Production of Residual Fuel Oil, Greater Than 1% Sulfur (Thousand Barrels) | ||||||||
| Decade | Year-0 | Year-1 | Year-2 | Year-3 | Year-4 | Year-5 | Year-6 | Year-7 | Year-8 | Year-9 |
|---|---|---|---|---|---|---|---|---|---|---|
| 2000's | 19,166 | 18,160 | 18,535 | 15,629 | 13,951 | |||||
| 2010's | 14,014 | 14,757 | 13,865 | 15,602 | 17,019 | 16,624 | 15,369 | 14,999 | 14,527 | 12,973 |
| 2020's | 6,127 | 7,695 | 7,135 | 6,905 |
| - = No Data Reported; -- = Not Applicable; NA = Not Available; W = Withheld to avoid disclosure of individual company data. |
| Release Date: 6/28/2024 |
| Next Release Date: 8/30/2024 |