|
Download Data (XLS File) |
|
||||||||
|
||||||||
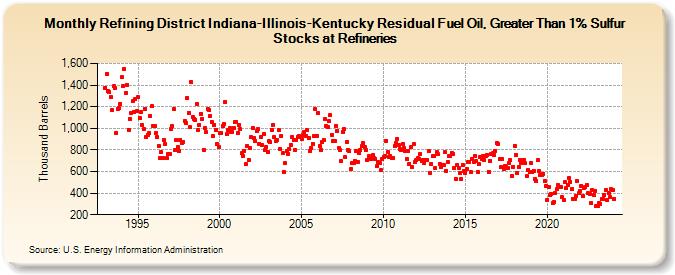
| Refining District Indiana-Illinois-Kentucky Residual Fuel Oil, Greater Than 1% Sulfur Stocks at Refineries (Thousand Barrels) | ||||||||
| Year | Jan | Feb | Mar | Apr | May | Jun | Jul | Aug | Sep | Oct | Nov | Dec |
|---|---|---|---|---|---|---|---|---|---|---|---|---|
| 1993 | 1,375 | 1,505 | 1,344 | 1,334 | 1,288 | 1,168 | 1,387 | 1,369 | 959 | 1,180 | 1,186 | 1,229 |
| 1994 | 1,471 | 1,396 | 1,550 | 1,329 | 1,402 | 987 | 1,083 | 1,137 | 1,249 | 1,149 | 1,268 | 1,159 |
| 1995 | 1,287 | 1,094 | 1,149 | 1,031 | 990 | 1,180 | 920 | 941 | 953 | 1,116 | 1,204 | 1,022 |
| 1996 | 1,019 | 954 | 917 | 838 | 727 | 777 | 723 | 891 | 851 | 723 | 765 | 758 |
| 1997 | 992 | 1,019 | 1,180 | 797 | 889 | 825 | 789 | 894 | 865 | 875 | 1,068 | 1,052 |
| 1998 | 1,283 | 1,144 | 1,008 | 1,427 | 1,106 | 1,089 | 1,079 | 1,227 | 988 | 1,031 | 1,136 | 1,088 |
| 1999 | 802 | 1,001 | 964 | 1,174 | 1,168 | 1,112 | 1,059 | 930 | 1,032 | 982 | 854 | 825 |
| 2000 | 957 | 955 | 1,017 | 1,037 | 1,242 | 944 | 982 | 1,000 | 968 | 968 | 1,005 | 1,054 |
| 2001 | 1,062 | 956 | 1,034 | 993 | 769 | 747 | 793 | 667 | 837 | 706 | 814 | 918 |
| 2002 | 1,005 | 910 | 881 | 972 | 995 | 857 | 924 | 849 | 949 | 799 | 829 | 777 |
| 2003 | 878 | 869 | 985 | 1,031 | 915 | 882 | 892 | 986 | 810 | 928 | 771 | 592 |
| 2004 | 676 | 788 | 765 | 804 | 848 | 920 | 888 | 801 | 895 | 920 | 933 | 924 |
| 2005 | 904 | 935 | 963 | 933 | 981 | 911 | 793 | 817 | 859 | 928 | 1,178 | 930 |
| 2006 | 1,142 | 834 | 797 | 869 | 894 | 1,083 | 1,021 | 1,010 | 1,067 | 1,121 | 942 | 883 |
| 2007 | 884 | 1,024 | 975 | 816 | 803 | 697 | 967 | 992 | 731 | 873 | 803 | 788 |
| 2008 | 620 | 678 | 681 | 701 | 790 | 692 | 772 | 802 | 834 | 861 | 823 | 798 |
| 2009 | 703 | 739 | 729 | 718 | 751 | 726 | 717 | 647 | 689 | 678 | 611 | 720 |
| 2010 | 736 | 744 | 887 | 779 | 734 | 743 | 728 | 727 | 838 | 865 | 905 | 847 |
| 2011 | 806 | 801 | 858 | 814 | 789 | 712 | 788 | 672 | 823 | 638 | 850 | 688 |
| 2012 | 708 | 725 | 717 | 762 | 698 | 710 | 679 | 707 | 702 | 787 | 589 | 673 |
| 2013 | 741 | 747 | 634 | 777 | 759 | 674 | 641 | 657 | 661 | 776 | 605 | 688 |
| 2014 | 745 | 747 | 774 | 766 | 635 | 532 | 658 | 633 | 584 | 527 | 658 | 602 |
| 2015 | 590 | 622 | 686 | 692 | 592 | 717 | 692 | 742 | 697 | 596 | 665 | 732 |
| 2016 | 714 | 741 | 711 | 745 | 753 | 600 | 700 | 759 | 768 | 757 | 792 | 865 |
| 2017 | 858 | 718 | 638 | 717 | 619 | 653 | 640 | 634 | 678 | 706 | 559 | 645 |
| 2018 | 837 | 757 | 585 | 642 | 709 | 678 | 692 | 711 | 676 | 555 | 618 | 593 |
| 2019 | 679 | 597 | 607 | 532 | 513 | 704 | 608 | 571 | 566 | 581 | 514 | 466 |
| 2020 | 337 | 459 | 383 | 392 | 312 | 322 | 403 | 440 | 475 | 461 | 455 | 360 |
| 2021 | 340 | 504 | 446 | 471 | 541 | 502 | 438 | 344 | 349 | 377 | 509 | 403 |
| 2022 | 418 | 468 | 374 | 448 | 459 | 473 | 397 | 393 | 309 | 427 | 384 | 423 |
| 2023 | 277 | 284 | 307 | 299 | 347 | 347 | 382 | 429 | 334 | 397 | 361 | 435 |
| 2024 | 428 | |||||||||||
| - = No Data Reported; -- = Not Applicable; NA = Not Available; W = Withheld to avoid disclosure of individual company data. |
| Release Date: 3/29/2024 |
| Next Release Date: 4/30/2024 |