|
Download Data (XLS File) |
|
||||||||
|
||||||||
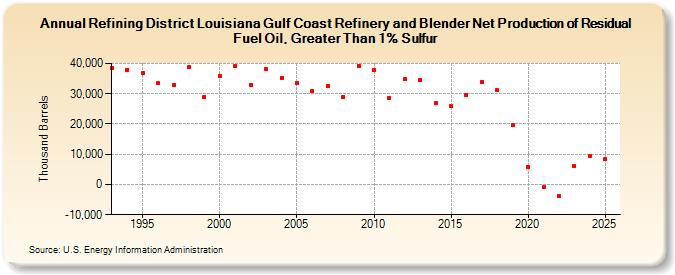
| Refining District Louisiana Gulf Coast Refinery and Blender Net Production of Residual Fuel Oil, Greater Than 1% Sulfur (Thousand Barrels) | ||||||||
| Decade | Year-0 | Year-1 | Year-2 | Year-3 | Year-4 | Year-5 | Year-6 | Year-7 | Year-8 | Year-9 |
|---|---|---|---|---|---|---|---|---|---|---|
| 1990's | 38,417 | 37,922 | 36,916 | 33,395 | 32,926 | 38,835 | 28,955 | |||
| 2000's | 35,908 | 39,111 | 33,005 | 38,216 | 35,271 | 33,440 | 31,056 | 32,517 | 28,836 | 39,235 |
| 2010's | 37,803 | 28,620 | 34,708 | 34,381 | 26,995 | 25,998 | 29,730 | 33,996 | 31,189 | 19,627 |
| 2020's | 5,826 | -931 | -3,823 | 6,153 |
| - = No Data Reported; -- = Not Applicable; NA = Not Available; W = Withheld to avoid disclosure of individual company data. |
| Release Date: 6/28/2024 |
| Next Release Date: 8/30/2024 |