|
Download Data (XLS File) |
|
||||||||
|
||||||||
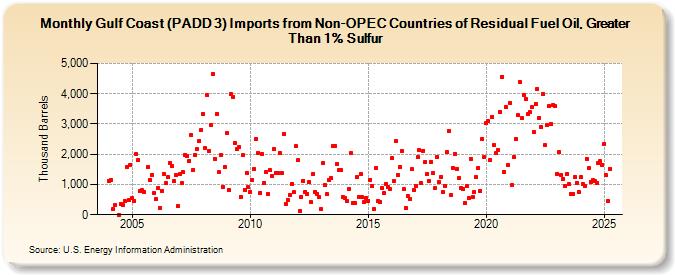
| Gulf Coast (PADD 3) Imports from Non-OPEC Countries of Residual Fuel Oil, Greater Than 1% Sulfur (Thousand Barrels) | ||||||||
| Year | Jan | Feb | Mar | Apr | May | Jun | Jul | Aug | Sep | Oct | Nov | Dec |
|---|---|---|---|---|---|---|---|---|---|---|---|---|
| 2004 | 1,125 | 1,140 | 188 | 307 | 4 | 358 | 321 | 461 | 1,563 | 493 | 1,659 | |
| 2005 | 557 | 462 | 2,006 | 1,813 | 795 | 806 | 762 | 1,572 | 1,164 | 1,317 | 730 | |
| 2006 | 505 | 888 | 215 | 798 | 1,355 | 1,034 | 1,250 | 1,712 | 1,614 | 1,103 | 1,325 | 280 |
| 2007 | 1,332 | 1,039 | 1,398 | 1,969 | 1,927 | 1,776 | 2,634 | 1,485 | 1,989 | 2,163 | 2,443 | 2,801 |
| 2008 | 3,346 | 2,195 | 3,943 | 2,117 | 2,973 | 4,658 | 1,857 | 3,332 | 1,403 | 1,966 | 929 | 1,573 |
| 2009 | 2,700 | 832 | 3,982 | 3,897 | 2,375 | 2,159 | 2,245 | 599 | 1,963 | 824 | 1,371 | 917 |
| 2010 | 767 | 1,137 | 1,510 | 2,503 | 2,047 | 726 | 2,011 | 1,060 | 1,400 | 690 | 1,463 | 1,293 |
| 2011 | 2,161 | 1,390 | 1,379 | 2,050 | 1,379 | 2,671 | 370 | 481 | 663 | 1,018 | 738 | 2,267 |
| 2012 | 1,807 | 121 | 591 | 1,120 | 760 | 697 | 1,079 | 413 | 1,362 | 754 | 697 | 576 |
| 2013 | 183 | 1,711 | 972 | 669 | 1,141 | 1,204 | 2,264 | 2,275 | 1,670 | 1,464 | 1,462 | 586 |
| 2014 | 559 | 447 | 852 | 2,032 | 401 | 373 | 1,242 | 591 | 1,331 | 576 | 423 | 563 |
| 2015 | 462 | 1,160 | 951 | 196 | 1,545 | 458 | 418 | 888 | 714 | 1,031 | 918 | 843 |
| 2016 | 1,869 | 1,114 | 2,423 | 1,314 | 1,577 | 2,100 | 836 | 236 | 612 | 506 | 1,503 | 812 |
| 2017 | 942 | 1,892 | 2,141 | 1,038 | 2,123 | 1,754 | 1,340 | 1,114 | 1,749 | 1,378 | 881 | 1,907 |
| 2018 | 1,085 | 1,248 | 737 | 945 | 2,069 | 2,768 | 661 | 1,554 | 2,022 | 1,527 | 1,203 | 891 |
| 2019 | 857 | 377 | 944 | 550 | 1,855 | 595 | 748 | 1,236 | 1,560 | 798 | 2,515 | 1,914 |
| 2020 | 3,041 | 3,084 | 1,810 | 3,231 | 2,297 | 2,031 | 2,138 | 3,411 | 4,569 | 1,424 | 3,572 | 1,637 |
| 2021 | 3,707 | 993 | 1,895 | 2,507 | 3,283 | 4,389 | 3,185 | 3,950 | 3,839 | 3,324 | 3,395 | 3,546 |
| 2022 | 2,745 | 3,668 | 4,172 | 3,206 | 2,892 | 3,988 | 2,290 | 2,955 | 3,593 | 2,998 | 3,640 | 3,599 |
| 2023 | 1,352 | 2,066 | 1,328 | 938 | 937 | 1,350 | 1,006 | 697 | 682 | 1,247 | 1,065 | 739 |
| 2024 | 1,232 | 1,001 | 951 | 1,856 | ||||||||
| - = No Data Reported; -- = Not Applicable; NA = Not Available; W = Withheld to avoid disclosure of individual company data. |
| Release Date: 6/28/2024 |
| Next Release Date: 7/31/2024 |