|
Download Data (XLS File) |
|
||||||||
|
||||||||
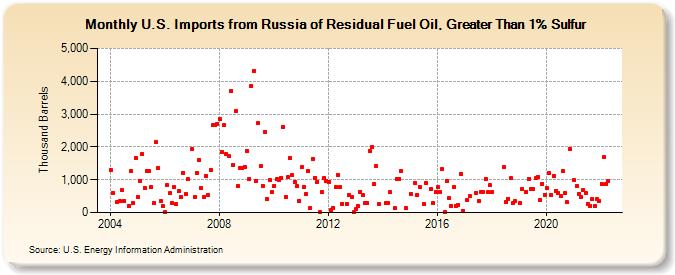
| U.S. Imports from Russia of Residual Fuel Oil, Greater Than 1% Sulfur (Thousand Barrels) | ||||||||
| Year | Jan | Feb | Mar | Apr | May | Jun | Jul | Aug | Sep | Oct | Nov | Dec |
|---|---|---|---|---|---|---|---|---|---|---|---|---|
| 2004 | 1,292 | 609 | 307 | 340 | 682 | 358 | 192 | 1,269 | 301 | 1,667 | ||
| 2005 | 469 | 964 | 1,781 | 760 | 1,271 | 1,264 | 772 | 282 | 2,140 | 1,360 | 341 | 198 |
| 2006 | 5 | 825 | 587 | 282 | 785 | 251 | 646 | 473 | 1,217 | 562 | 1,011 | |
| 2007 | 1,936 | 462 | 1,218 | 1,607 | 747 | 461 | 1,127 | 526 | 1,299 | 2,654 | 2,668 | 2,705 |
| 2008 | 2,861 | 1,852 | 2,662 | 1,780 | 1,735 | 3,710 | 1,446 | 3,085 | 822 | 1,347 | 1,345 | 1,400 |
| 2009 | 1,877 | 1,029 | 3,861 | 4,319 | 968 | 2,725 | 1,405 | 823 | 2,463 | 405 | 983 | 628 |
| 2010 | 815 | 1,012 | 985 | 1,062 | 2,611 | 474 | 1,079 | 1,656 | 1,144 | 942 | 800 | 364 |
| 2011 | 1,374 | 782 | 570 | 1,271 | 143 | 1,638 | 1,053 | 942 | 9 | 634 | 1,055 | 947 |
| 2012 | 933 | 72 | 143 | 776 | 1,155 | 790 | 268 | 254 | 537 | 482 | 3 | |
| 2013 | 95 | 196 | 632 | 537 | 289 | 277 | 1,874 | 2,001 | 881 | 1,414 | 256 | |
| 2014 | 290 | 302 | 625 | 129 | 1,034 | 1,034 | 1,259 | 130 | ||||
| 2015 | 566 | 897 | 549 | 786 | 261 | 894 | 725 | 282 | 623 | |||
| 2016 | 774 | 623 | 1,313 | 19 | 973 | 438 | 207 | 793 | 202 | 234 | 1,181 | 60 |
| 2017 | 379 | 491 | 607 | 352 | 637 | 631 | 1,033 | 611 | 825 | |||
| 2018 | 620 | 1,386 | 314 | 428 | 1,040 | 301 | 342 | |||||
| 2019 | 278 | 719 | 635 | 1,037 | 723 | 719 | 1,043 | 1,093 | 394 | 878 | 540 | |
| 2020 | 755 | 1,194 | 539 | 1,120 | 662 | 595 | 514 | 1,278 | 593 | 309 | 1,929 | |
| 2021 | 981 | 816 | 579 | 478 | 695 | 602 | 260 | 197 | 416 | 195 | 399 | 364 |
| 2022 | 879 | 1,687 | 861 | 961 | ||||||||
| - = No Data Reported; -- = Not Applicable; NA = Not Available; W = Withheld to avoid disclosure of individual company data. |
| Release Date: 6/28/2024 |
| Next Release Date: 7/31/2024 |