|
Download Data (XLS File) |
|
||||||||
|
||||||||
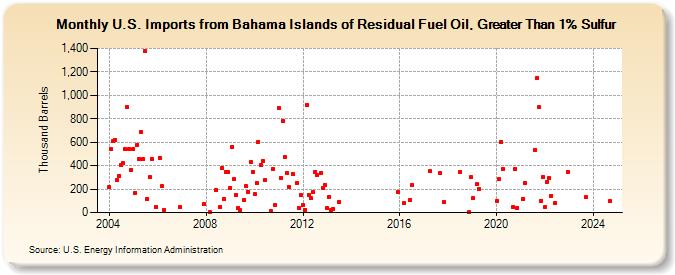
| U.S. Imports from Bahama Islands of Residual Fuel Oil, Greater Than 1% Sulfur (Thousand Barrels) | ||||||||
| Year | Jan | Feb | Mar | Apr | May | Jun | Jul | Aug | Sep | Oct | Nov | Dec |
|---|---|---|---|---|---|---|---|---|---|---|---|---|
| 2004 | 215 | 542 | 607 | 623 | 277 | 316 | 405 | 422 | 538 | 896 | 538 | 366 |
| 2005 | 541 | 170 | 578 | 456 | 691 | 455 | 1,379 | 117 | 301 | 460 | 50 | |
| 2006 | 468 | 223 | 20 | 45 | ||||||||
| 2007 | 72 | |||||||||||
| 2008 | 2 | 192 | 51 | 383 | 114 | 343 | 346 | |||||
| 2009 | 212 | 563 | 284 | 153 | 42 | 18 | 110 | 223 | 179 | 428 | 347 | |
| 2010 | 155 | 253 | 605 | 405 | 443 | 276 | 13 | 370 | 61 | |||
| 2011 | 890 | 295 | 780 | 473 | 336 | 221 | 332 | 253 | 39 | 149 | ||
| 2012 | 64 | 25 | 919 | 147 | 120 | 173 | 349 | 320 | 338 | 210 | 234 | |
| 2013 | 37 | 133 | 19 | 32 | 93 | |||||||
| 2015 | 178 | |||||||||||
| 2016 | 78 | 111 | 236 | |||||||||
| 2017 | 351 | 339 | 89 | |||||||||
| 2018 | 350 | 1 | 300 | |||||||||
| 2019 | 121 | 241 | 200 | |||||||||
| 2020 | 101 | 284 | 602 | 371 | 50 | 368 | 41 | |||||
| 2021 | 116 | 250 | 537 | 1,148 | 898 | 101 | 307 | |||||
| 2022 | 48 | 263 | 293 | 143 | 82 | 350 | ||||||
| 2023 | 129 | |||||||||||
| - = No Data Reported; -- = Not Applicable; NA = Not Available; W = Withheld to avoid disclosure of individual company data. |
| Release Date: 3/29/2024 |
| Next Release Date: 4/30/2024 |