|
Download Data (XLS File) |
|
||||||||
|
||||||||
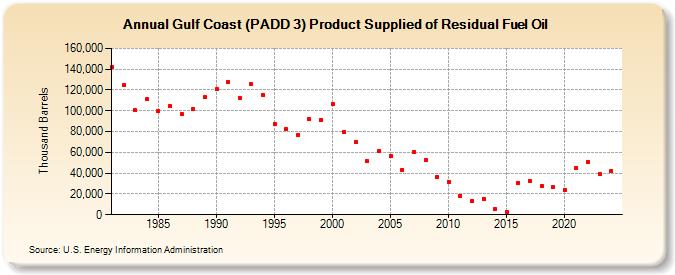
| Gulf Coast (PADD 3) Product Supplied of Residual Fuel Oil (Thousand Barrels) | ||||||||
| Decade | Year-0 | Year-1 | Year-2 | Year-3 | Year-4 | Year-5 | Year-6 | Year-7 | Year-8 | Year-9 |
|---|---|---|---|---|---|---|---|---|---|---|
| 1980's | 142,075 | 124,769 | 100,407 | 111,122 | 99,665 | 104,652 | 97,016 | 101,400 | 113,085 | |
| 1990's | 120,551 | 127,614 | 112,663 | 125,464 | 115,135 | 87,119 | 82,020 | 76,760 | 92,237 | 91,485 |
| 2000's | 106,187 | 79,797 | 70,328 | 51,381 | 61,656 | 56,707 | 43,027 | 60,718 | 52,517 | 36,561 |
| 2010's | 31,638 | 18,471 | 13,380 | 15,397 | 5,546 | 2,591 | 30,648 | 32,377 | 27,998 | 26,854 |
| 2020's | 24,246 | 45,122 | 50,569 | 39,469 |
| - = No Data Reported; -- = Not Applicable; NA = Not Available; W = Withheld to avoid disclosure of individual company data. |
| Release Date: 6/28/2024 |
| Next Release Date: 8/30/2024 |