|
Download Data (XLS File) |
|
||||||||
|
||||||||
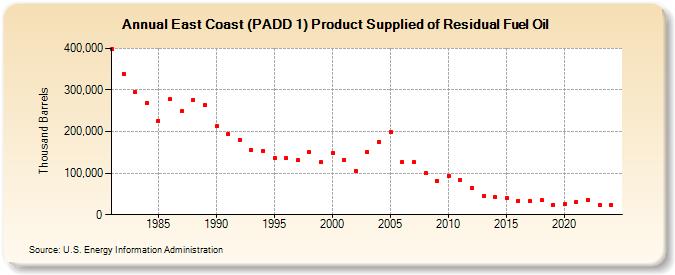
| East Coast (PADD 1) Product Supplied of Residual Fuel Oil (Thousand Barrels) | ||||||||
| Decade | Year-0 | Year-1 | Year-2 | Year-3 | Year-4 | Year-5 | Year-6 | Year-7 | Year-8 | Year-9 |
|---|---|---|---|---|---|---|---|---|---|---|
| 1980's | 398,560 | 339,611 | 296,099 | 268,403 | 226,338 | 277,464 | 248,493 | 276,271 | 262,974 | |
| 1990's | 212,401 | 193,327 | 180,312 | 155,216 | 154,174 | 136,567 | 136,301 | 130,888 | 149,724 | 125,825 |
| 2000's | 148,244 | 131,902 | 105,235 | 151,146 | 175,319 | 198,413 | 126,996 | 125,779 | 99,301 | 81,918 |
| 2010's | 94,042 | 82,771 | 64,742 | 44,411 | 41,800 | 40,436 | 33,904 | 32,070 | 34,870 | 24,178 |
| 2020's | 24,698 | 30,848 | 36,498 | 24,649 |
| - = No Data Reported; -- = Not Applicable; NA = Not Available; W = Withheld to avoid disclosure of individual company data. |
| Release Date: 4/30/2024 |
| Next Release Date: 8/30/2024 |