|
Download Data (XLS File) |
|
||||||||
|
||||||||
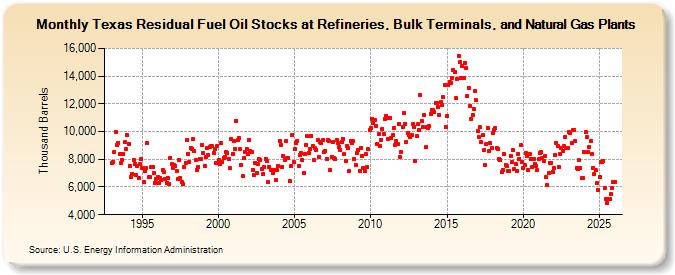
| Texas Residual Fuel Oil Stocks at Refineries, Bulk Terminals, and Natural Gas Plants (Thousand Barrels) | ||||||||
| Year | Jan | Feb | Mar | Apr | May | Jun | Jul | Aug | Sep | Oct | Nov | Dec |
|---|---|---|---|---|---|---|---|---|---|---|---|---|
| 1993 | 7,715 | 7,817 | 8,529 | 9,996 | 9,048 | 9,197 | 8,383 | 7,731 | 7,976 | 8,370 | 9,257 | 8,763 |
| 1994 | 9,735 | 9,102 | 7,546 | 6,722 | 6,968 | 7,982 | 7,666 | 6,842 | 7,486 | 6,653 | 7,680 | 7,991 |
| 1995 | 7,363 | 6,393 | 7,179 | 7,336 | 9,156 | 6,696 | 6,699 | 7,466 | 7,421 | 7,010 | 6,279 | 6,601 |
| 1996 | 6,754 | 6,281 | 6,659 | 6,508 | 7,242 | 7,066 | 6,548 | 6,287 | 6,655 | 6,247 | 8,126 | 7,644 |
| 1997 | 7,375 | 7,581 | 7,520 | 7,151 | 6,577 | 7,964 | 6,684 | 6,360 | 6,181 | 7,419 | 7,757 | 9,369 |
| 1998 | 8,369 | 7,817 | 8,814 | 8,765 | 9,468 | 8,605 | 7,964 | 7,223 | 7,447 | 8,033 | 8,036 | 9,062 |
| 1999 | 8,446 | 7,532 | 8,133 | 8,839 | 8,338 | 8,882 | 8,952 | 8,930 | 8,453 | 8,753 | 7,766 | 8,993 |
| 2000 | 7,928 | 7,663 | 9,150 | 7,816 | 8,057 | 8,164 | 8,522 | 8,467 | 8,009 | 7,340 | 9,445 | 8,370 |
| 2001 | 9,350 | 8,772 | 10,788 | 9,365 | 9,541 | 8,726 | 7,558 | 6,797 | 8,105 | 8,496 | 8,749 | 8,356 |
| 2002 | 9,400 | 8,607 | 8,500 | 7,248 | 6,892 | 7,741 | 7,026 | 7,633 | 8,019 | 7,946 | 7,312 | 6,919 |
| 2003 | 7,413 | 8,045 | 7,900 | 6,326 | 7,467 | 7,255 | 7,242 | 7,041 | 7,249 | 6,496 | 7,217 | 7,499 |
| 2004 | 9,304 | 9,031 | 7,449 | 8,243 | 7,983 | 9,295 | 8,066 | 8,076 | 6,417 | 7,489 | 9,774 | 7,771 |
| 2005 | 8,740 | 9,179 | 9,341 | 7,528 | 8,285 | 8,468 | 7,952 | 7,015 | 8,380 | 9,037 | 9,645 | 8,471 |
| 2006 | 8,754 | 9,666 | 8,951 | 7,952 | 8,782 | 8,674 | 9,381 | 8,143 | 9,228 | 9,199 | 9,380 | 8,498 |
| 2007 | 8,608 | 8,017 | 9,413 | 9,336 | 7,260 | 8,176 | 9,225 | 8,076 | 8,001 | 9,385 | 9,197 | 8,854 |
| 2008 | 8,696 | 9,226 | 9,497 | 8,345 | 7,862 | 8,941 | 8,827 | 7,148 | 9,305 | 9,190 | 9,317 | 8,036 |
| 2009 | 7,586 | 8,478 | 8,641 | 7,155 | 8,824 | 8,255 | 7,403 | 7,149 | 8,358 | 7,436 | 8,729 | 10,132 |
| 2010 | 10,266 | 10,893 | 10,611 | 10,842 | 10,418 | 9,113 | 9,817 | 8,959 | 9,397 | 10,172 | 9,847 | 10,933 |
| 2011 | 11,144 | 9,461 | 10,994 | 10,980 | 9,513 | 9,738 | 10,291 | 8,996 | 9,327 | 9,107 | 10,552 | 8,152 |
| 2012 | 8,503 | 10,328 | 11,336 | 10,565 | 9,266 | 9,860 | 9,743 | 9,571 | 9,763 | 10,521 | 10,309 | 7,875 |
| 2013 | 9,699 | 10,525 | 10,124 | 12,650 | 10,748 | 10,322 | 11,211 | 8,865 | 10,297 | 10,246 | 10,367 | 11,302 |
| 2014 | 11,587 | 11,537 | 11,406 | 12,024 | 12,057 | 11,759 | 11,208 | 12,109 | 11,888 | 12,477 | 13,341 | 10,357 |
| 2015 | 11,111 | 13,370 | 13,592 | 13,521 | 13,830 | 14,452 | 14,284 | 12,392 | 13,773 | 15,450 | 14,993 | 13,865 |
| 2016 | 14,749 | 13,849 | 14,982 | 14,609 | 12,552 | 13,148 | 11,831 | 10,892 | 11,169 | 11,626 | 12,940 | 12,254 |
| 2017 | 10,008 | 9,618 | 10,307 | 9,224 | 9,752 | 8,633 | 7,571 | 9,120 | 10,279 | 8,564 | 9,149 | 8,801 |
| 2018 | 9,870 | 10,114 | 10,250 | 8,829 | 8,763 | 8,049 | 7,976 | 7,084 | 7,252 | 8,356 | 7,587 | 7,502 |
| 2019 | 7,171 | 7,161 | 8,252 | 7,808 | 8,656 | 7,284 | 7,666 | 7,172 | 8,409 | 8,040 | 9,006 | 7,832 |
| 2020 | 7,381 | 7,584 | 8,463 | 8,240 | 7,191 | 8,408 | 8,019 | 7,453 | 8,031 | 7,663 | 7,510 | 7,204 |
| 2021 | 8,004 | 8,481 | 8,516 | 8,067 | 7,855 | 8,220 | 6,748 | 6,131 | 6,981 | 7,751 | 7,750 | 7,111 |
| 2022 | 7,406 | 8,327 | 9,204 | 8,984 | 7,453 | 8,375 | 8,779 | 8,564 | 8,937 | 9,614 | 8,784 | 8,804 |
| 2023 | 9,957 | 9,864 | 9,163 | 10,114 | 10,106 | 9,295 | 7,355 | 7,263 | 7,915 | 7,381 | 6,638 | 6,633 |
| 2024 | 8,531 | |||||||||||
| - = No Data Reported; -- = Not Applicable; NA = Not Available; W = Withheld to avoid disclosure of individual company data. |
| Release Date: 3/29/2024 |
| Next Release Date: 4/30/2024 |