|
Download Data (XLS File) |
|
||||||||
|
||||||||
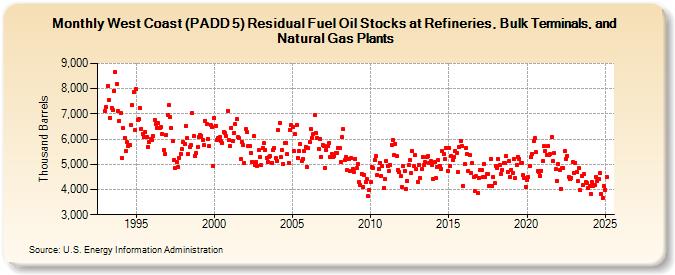
| West Coast (PADD 5) Residual Fuel Oil Stocks at Refineries, Bulk Terminals, and Natural Gas Plants (Thousand Barrels) | ||||||||
| Year | Jan | Feb | Mar | Apr | May | Jun | Jul | Aug | Sep | Oct | Nov | Dec |
|---|---|---|---|---|---|---|---|---|---|---|---|---|
| 1993 | 7,110 | 7,282 | 8,107 | 7,553 | 6,848 | 7,249 | 7,163 | 7,924 | 8,655 | 8,195 | 7,101 | 6,730 |
| 1994 | 7,055 | 5,251 | 6,438 | 6,045 | 5,523 | 5,868 | 5,710 | 5,782 | 6,547 | 7,337 | 7,858 | 6,342 |
| 1995 | 7,973 | 6,775 | 6,787 | 7,226 | 6,414 | 6,219 | 6,084 | 6,280 | 6,094 | 5,705 | 5,898 | 5,994 |
| 1996 | 5,968 | 6,114 | 6,769 | 6,588 | 6,454 | 6,624 | 6,449 | 6,475 | 6,206 | 5,562 | 5,406 | 6,157 |
| 1997 | 6,950 | 7,338 | 6,875 | 6,448 | 5,919 | 5,178 | 4,856 | 5,097 | 4,897 | 5,263 | 5,424 | 5,592 |
| 1998 | 5,870 | 5,810 | 6,530 | 6,029 | 5,398 | 5,689 | 5,747 | 7,044 | 6,111 | 5,330 | 5,467 | 5,687 |
| 1999 | 6,086 | 6,165 | 6,123 | 5,979 | 5,761 | 6,729 | 6,616 | 5,986 | 5,724 | 6,577 | 6,486 | 4,914 |
| 2000 | 6,846 | 6,533 | 5,960 | 6,024 | 6,067 | 5,906 | 5,841 | 6,284 | 6,238 | 6,107 | 7,125 | 5,948 |
| 2001 | 5,742 | 6,456 | 5,926 | 6,255 | 6,584 | 6,795 | 6,067 | 6,031 | 5,198 | 5,895 | 5,774 | 5,042 |
| 2002 | 6,389 | 6,269 | 5,715 | 5,714 | 5,467 | 5,092 | 6,108 | 4,965 | 5,097 | 4,945 | 5,564 | 5,279 |
| 2003 | 4,964 | 5,659 | 5,832 | 5,578 | 5,264 | 5,084 | 5,292 | 5,325 | 5,071 | 5,575 | 5,643 | 5,248 |
| 2004 | 5,149 | 6,355 | 6,649 | 5,276 | 5,573 | 4,994 | 5,858 | 5,859 | 5,389 | 5,068 | 6,377 | 6,544 |
| 2005 | 6,482 | 5,509 | 6,198 | 6,566 | 5,267 | 5,536 | 5,794 | 5,112 | 5,230 | 5,537 | 5,702 | 4,888 |
| 2006 | 5,627 | 5,872 | 6,397 | 6,055 | 6,212 | 6,950 | 6,235 | 6,060 | 5,606 | 6,015 | 5,304 | 5,774 |
| 2007 | 5,740 | 4,868 | 5,584 | 5,708 | 5,834 | 5,283 | 5,421 | 5,289 | 5,331 | 5,457 | 5,462 | 5,647 |
| 2008 | 5,645 | 5,086 | 6,091 | 6,390 | 5,173 | 5,305 | 4,757 | 5,220 | 4,744 | 5,268 | 4,818 | 4,698 |
| 2009 | 5,222 | 4,852 | 5,020 | 4,298 | 4,177 | 4,635 | 4,099 | 4,586 | 4,292 | 4,401 | 3,730 | 3,989 |
| 2010 | 4,298 | 4,877 | 4,835 | 5,168 | 5,325 | 4,573 | 4,813 | 5,063 | 4,543 | 4,918 | 4,070 | 4,418 |
| 2011 | 5,139 | 4,924 | 4,732 | 4,986 | 5,757 | 5,960 | 5,357 | 5,817 | 5,314 | 4,791 | 4,679 | 4,530 |
| 2012 | 4,098 | 4,939 | 4,743 | 4,008 | 4,338 | 4,959 | 5,158 | 4,649 | 5,530 | 4,920 | 5,355 | 4,804 |
| 2013 | 4,310 | 4,977 | 4,453 | 4,797 | 5,294 | 4,972 | 5,082 | 5,308 | 5,319 | 5,070 | 5,122 | 4,979 |
| 2014 | 4,420 | 5,075 | 4,448 | 4,911 | 5,167 | 4,936 | 4,813 | 5,511 | 5,425 | 5,196 | 5,631 | 4,739 |
| 2015 | 5,643 | 4,941 | 5,338 | 5,166 | 5,289 | 5,534 | 5,463 | 4,680 | 5,687 | 5,944 | 5,735 | 4,148 |
| 2016 | 4,999 | 5,640 | 5,409 | 4,734 | 5,364 | 4,653 | 5,038 | 4,487 | 3,938 | 4,525 | 3,874 | 4,476 |
| 2017 | 4,758 | 4,761 | 4,489 | 5,024 | 4,477 | 4,604 | 4,618 | 4,147 | 5,219 | 4,157 | 4,499 | 4,244 |
| 2018 | 4,932 | 4,861 | 5,201 | 4,964 | 4,630 | 4,779 | 5,058 | 5,034 | 5,318 | 4,702 | 5,136 | 4,508 |
| 2019 | 4,785 | 4,650 | 5,214 | 4,462 | 4,970 | 5,308 | 5,228 | 5,046 | 5,061 | 4,565 | 4,462 | 4,112 |
| 2020 | 4,394 | 4,500 | 4,946 | 5,281 | 5,423 | 5,936 | 6,024 | 5,476 | 4,716 | 4,697 | 4,548 | 4,745 |
| 2021 | 5,126 | 5,720 | 5,521 | 5,380 | 5,724 | 5,385 | 5,400 | 6,095 | 5,127 | 5,458 | 4,799 | 4,350 |
| 2022 | 5,001 | 4,766 | 4,032 | 4,842 | 4,837 | 5,509 | 5,199 | 5,337 | 4,501 | 4,404 | 4,468 | 5,090 |
| 2023 | 4,673 | 5,071 | 4,709 | 4,321 | 4,842 | 3,964 | 4,540 | 4,172 | 4,384 | 4,289 | 4,275 | 4,078 |
| 2024 | 4,122 | |||||||||||
| - = No Data Reported; -- = Not Applicable; NA = Not Available; W = Withheld to avoid disclosure of individual company data. |
| Release Date: 3/29/2024 |
| Next Release Date: 4/30/2024 |