|
Download Data (XLS File) |
|
||||||||
|
||||||||
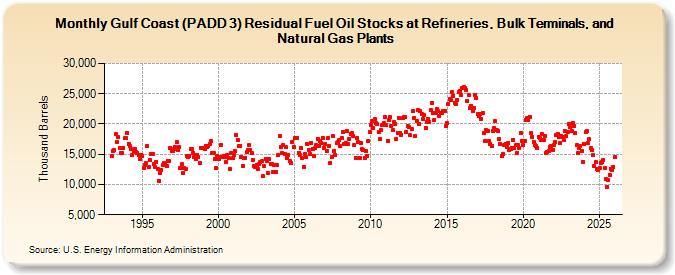
| Gulf Coast (PADD 3) Residual Fuel Oil Stocks at Refineries, Bulk Terminals, and Natural Gas Plants (Thousand Barrels) | ||||||||
| Year | Jan | Feb | Mar | Apr | May | Jun | Jul | Aug | Sep | Oct | Nov | Dec |
|---|---|---|---|---|---|---|---|---|---|---|---|---|
| 1993 | 14,630 | 15,574 | 15,679 | 18,273 | 17,053 | 17,844 | 16,109 | 15,120 | 15,229 | 16,088 | 17,610 | 17,610 |
| 1994 | 18,561 | 16,743 | 16,317 | 15,787 | 14,907 | 15,560 | 15,918 | 15,396 | 15,205 | 14,798 | 14,221 | 14,906 |
| 1995 | 14,667 | 12,759 | 13,284 | 13,585 | 16,329 | 12,865 | 14,001 | 15,082 | 15,055 | 13,381 | 12,827 | 13,736 |
| 1996 | 12,477 | 10,645 | 11,944 | 12,345 | 13,253 | 13,577 | 13,305 | 13,091 | 13,922 | 13,813 | 16,066 | 15,493 |
| 1997 | 15,484 | 15,834 | 16,143 | 16,993 | 15,676 | 16,128 | 12,759 | 13,333 | 11,904 | 12,779 | 12,507 | 14,745 |
| 1998 | 14,597 | 14,689 | 15,866 | 15,815 | 15,271 | 14,610 | 14,203 | 14,898 | 14,487 | 13,521 | 16,054 | 16,085 |
| 1999 | 16,052 | 15,894 | 16,399 | 16,186 | 16,380 | 16,637 | 17,171 | 15,255 | 15,143 | 14,175 | 12,709 | 14,663 |
| 2000 | 14,245 | 14,481 | 16,453 | 14,561 | 14,772 | 14,486 | 13,723 | 14,898 | 14,317 | 12,561 | 15,207 | 14,311 |
| 2001 | 14,881 | 15,499 | 18,206 | 17,338 | 16,350 | 16,391 | 14,520 | 13,060 | 14,324 | 14,451 | 15,296 | 15,647 |
| 2002 | 16,450 | 15,694 | 15,200 | 14,100 | 13,085 | 12,938 | 13,216 | 12,563 | 13,333 | 13,764 | 13,860 | 11,370 |
| 2003 | 13,048 | 14,254 | 13,875 | 11,885 | 14,147 | 13,346 | 13,360 | 12,040 | 13,241 | 12,103 | 13,266 | 14,862 |
| 2004 | 17,985 | 16,223 | 15,149 | 16,451 | 15,035 | 16,132 | 14,312 | 14,876 | 13,821 | 13,631 | 17,098 | 16,156 |
| 2005 | 17,689 | 17,662 | 17,659 | 15,203 | 14,899 | 16,042 | 14,373 | 12,899 | 14,969 | 14,524 | 16,648 | 15,742 |
| 2006 | 15,036 | 16,883 | 15,906 | 14,647 | 15,968 | 16,443 | 17,581 | 16,312 | 17,261 | 16,888 | 17,683 | 16,037 |
| 2007 | 16,722 | 15,462 | 17,622 | 16,394 | 13,548 | 14,459 | 17,933 | 15,553 | 14,814 | 16,796 | 16,962 | 17,276 |
| 2008 | 16,285 | 17,679 | 18,612 | 16,649 | 16,888 | 18,894 | 16,649 | 17,594 | 18,408 | 18,489 | 18,025 | 16,442 |
| 2009 | 14,387 | 17,662 | 16,991 | 14,444 | 16,922 | 15,825 | 15,712 | 14,417 | 15,551 | 14,640 | 17,108 | 18,719 |
| 2010 | 19,900 | 20,536 | 19,342 | 20,762 | 20,103 | 19,987 | 18,618 | 17,549 | 18,961 | 19,805 | 20,156 | 21,078 |
| 2011 | 19,787 | 17,246 | 20,598 | 21,093 | 19,648 | 18,947 | 20,277 | 20,066 | 17,547 | 18,580 | 21,041 | 18,432 |
| 2012 | 18,236 | 20,951 | 21,205 | 21,111 | 18,674 | 19,586 | 19,428 | 18,131 | 19,107 | 22,079 | 21,036 | 18,032 |
| 2013 | 20,466 | 22,285 | 20,076 | 22,078 | 21,582 | 20,816 | 21,466 | 19,407 | 20,331 | 20,863 | 20,263 | 22,284 |
| 2014 | 23,493 | 21,812 | 20,723 | 21,767 | 22,532 | 22,084 | 21,270 | 21,786 | 21,830 | 22,142 | 22,152 | 19,597 |
| 2015 | 20,091 | 23,267 | 24,050 | 23,915 | 25,266 | 24,684 | 23,467 | 23,263 | 23,998 | 25,225 | 25,512 | 24,866 |
| 2016 | 25,917 | 26,057 | 25,874 | 25,677 | 23,805 | 24,849 | 22,560 | 23,021 | 22,213 | 22,696 | 24,872 | 24,356 |
| 2017 | 21,616 | 21,252 | 21,651 | 20,841 | 21,767 | 18,488 | 17,149 | 18,948 | 18,820 | 17,239 | 16,725 | 16,374 |
| 2018 | 18,764 | 19,323 | 20,471 | 18,949 | 18,800 | 17,493 | 16,657 | 14,720 | 15,063 | 16,476 | 16,763 | 16,251 |
| 2019 | 16,884 | 15,735 | 15,872 | 16,050 | 17,410 | 16,061 | 16,471 | 15,275 | 16,462 | 16,067 | 18,536 | 17,225 |
| 2020 | 16,499 | 17,155 | 20,658 | 21,036 | 20,579 | 21,222 | 18,544 | 17,816 | 17,040 | 16,472 | 16,439 | 16,106 |
| 2021 | 17,853 | 17,758 | 17,332 | 18,320 | 17,346 | 17,940 | 15,247 | 15,427 | 15,497 | 16,220 | 16,354 | 15,710 |
| 2022 | 16,553 | 17,001 | 18,256 | 18,418 | 17,868 | 16,920 | 17,955 | 17,883 | 17,284 | 18,872 | 17,979 | 18,640 |
| 2023 | 20,024 | 19,447 | 18,865 | 20,187 | 19,728 | 18,531 | 16,450 | 15,326 | 15,958 | 16,152 | 15,455 | 13,775 |
| 2024 | 16,734 | |||||||||||
| - = No Data Reported; -- = Not Applicable; NA = Not Available; W = Withheld to avoid disclosure of individual company data. |
| Release Date: 3/29/2024 |
| Next Release Date: 4/30/2024 |