|
Download Data (XLS File) |
|
||||||||
|
||||||||
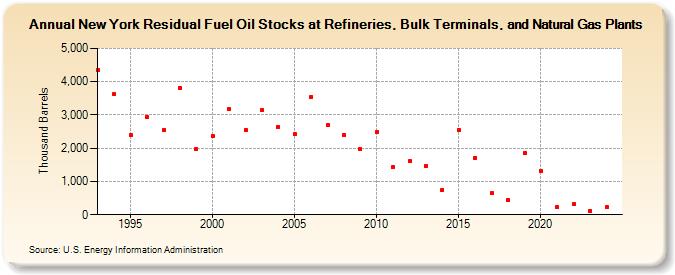
| New York Residual Fuel Oil Stocks at Refineries, Bulk Terminals, and Natural Gas Plants (Thousand Barrels) | ||||||||
| Decade | Year-0 | Year-1 | Year-2 | Year-3 | Year-4 | Year-5 | Year-6 | Year-7 | Year-8 | Year-9 |
|---|---|---|---|---|---|---|---|---|---|---|
| 1990's | 4,356 | 3,617 | 2,392 | 2,930 | 2,553 | 3,823 | 1,981 | |||
| 2000's | 2,363 | 3,176 | 2,553 | 3,141 | 2,643 | 2,417 | 3,551 | 2,686 | 2,392 | 1,963 |
| 2010's | 2,472 | 1,431 | 1,607 | 1,466 | 744 | 2,535 | 1,717 | 654 | 446 | 1,851 |
| 2020's | 1,320 | 219 | 308 | 117 |
| - = No Data Reported; -- = Not Applicable; NA = Not Available; W = Withheld to avoid disclosure of individual company data. |
| Release Date: 3/29/2024 |
| Next Release Date: 8/30/2024 |