|
Download Data (XLS File) |
|
||||||||
|
||||||||
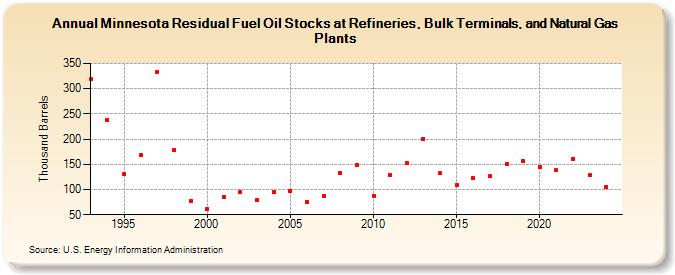
| Minnesota Residual Fuel Oil Stocks at Refineries, Bulk Terminals, and Natural Gas Plants (Thousand Barrels) | ||||||||
| Decade | Year-0 | Year-1 | Year-2 | Year-3 | Year-4 | Year-5 | Year-6 | Year-7 | Year-8 | Year-9 |
|---|---|---|---|---|---|---|---|---|---|---|
| 1990's | 319 | 238 | 130 | 168 | 334 | 178 | 78 | |||
| 2000's | 61 | 86 | 95 | 79 | 95 | 97 | 76 | 87 | 133 | 149 |
| 2010's | 87 | 129 | 152 | 201 | 132 | 109 | 122 | 126 | 150 | 157 |
| 2020's | 145 | 138 | 160 | 128 |
| - = No Data Reported; -- = Not Applicable; NA = Not Available; W = Withheld to avoid disclosure of individual company data. |
| Release Date: 8/30/2024 |
| Next Release Date: 8/29/2025 |