|
Download Data (XLS File) |
|
||||||||
|
||||||||
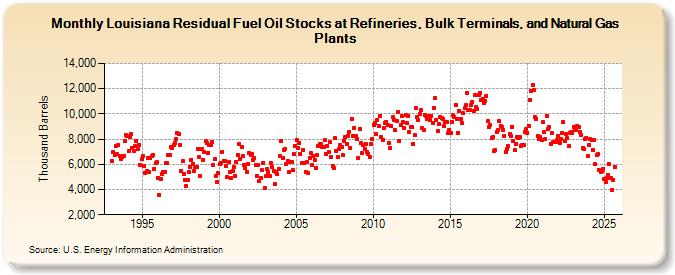
| Louisiana Residual Fuel Oil Stocks at Refineries, Bulk Terminals, and Natural Gas Plants (Thousand Barrels) | ||||||||
| Year | Jan | Feb | Mar | Apr | May | Jun | Jul | Aug | Sep | Oct | Nov | Dec |
|---|---|---|---|---|---|---|---|---|---|---|---|---|
| 1993 | 6,241 | 6,994 | 6,726 | 7,417 | 6,809 | 7,526 | 6,667 | 6,455 | 6,555 | 6,679 | 7,833 | 8,288 |
| 1994 | 8,233 | 7,059 | 8,145 | 8,395 | 7,270 | 7,054 | 7,420 | 7,874 | 7,178 | 7,538 | 5,914 | 6,429 |
| 1995 | 6,637 | 5,843 | 5,300 | 5,487 | 6,503 | 5,413 | 6,470 | 6,624 | 6,729 | 5,660 | 6,125 | 6,149 |
| 1996 | 4,933 | 3,548 | 4,806 | 5,251 | 5,412 | 5,417 | 6,098 | 6,086 | 6,757 | 6,744 | 7,393 | 7,255 |
| 1997 | 7,531 | 7,682 | 8,014 | 8,496 | 8,386 | 7,543 | 5,501 | 6,248 | 5,252 | 4,749 | 4,281 | 4,717 |
| 1998 | 5,423 | 5,766 | 6,367 | 6,023 | 5,457 | 5,776 | 5,818 | 7,243 | 6,592 | 5,095 | 7,196 | 6,358 |
| 1999 | 6,937 | 7,826 | 7,711 | 6,930 | 7,563 | 7,526 | 7,757 | 5,975 | 6,384 | 5,066 | 4,595 | 5,302 |
| 2000 | 6,020 | 6,143 | 6,977 | 6,267 | 6,283 | 5,878 | 4,967 | 6,183 | 5,416 | 4,900 | 5,434 | 5,778 |
| 2001 | 5,111 | 6,195 | 6,771 | 7,592 | 6,427 | 7,394 | 6,630 | 5,911 | 5,686 | 5,426 | 6,062 | 6,887 |
| 2002 | 6,755 | 6,824 | 6,369 | 6,499 | 5,931 | 5,041 | 5,957 | 4,703 | 4,927 | 5,543 | 6,142 | 4,153 |
| 2003 | 5,068 | 5,656 | 5,427 | 5,074 | 6,109 | 5,762 | 5,440 | 4,473 | 5,388 | 5,248 | 5,601 | 6,687 |
| 2004 | 7,849 | 6,500 | 7,170 | 7,243 | 6,049 | 6,267 | 5,350 | 6,173 | 6,154 | 5,543 | 6,781 | 7,456 |
| 2005 | 7,933 | 7,291 | 7,674 | 6,799 | 6,102 | 7,138 | 6,125 | 5,425 | 6,175 | 5,287 | 6,521 | 6,896 |
| 2006 | 5,968 | 6,626 | 6,357 | 5,743 | 6,726 | 7,413 | 7,630 | 7,596 | 7,399 | 7,382 | 7,919 | 6,822 |
| 2007 | 7,482 | 6,943 | 7,731 | 6,599 | 5,905 | 5,697 | 8,073 | 7,048 | 6,575 | 7,233 | 7,502 | 7,375 |
| 2008 | 6,727 | 7,859 | 8,148 | 7,647 | 8,268 | 8,569 | 7,325 | 9,580 | 8,276 | 8,910 | 8,245 | 8,023 |
| 2009 | 6,464 | 8,790 | 7,724 | 6,878 | 7,564 | 7,228 | 7,644 | 6,941 | 6,844 | 6,579 | 7,636 | 8,008 |
| 2010 | 9,148 | 9,269 | 8,392 | 9,539 | 9,037 | 9,801 | 8,169 | 7,949 | 8,897 | 9,244 | 9,390 | 9,142 |
| 2011 | 7,692 | 7,332 | 9,004 | 9,759 | 9,518 | 8,745 | 9,447 | 10,131 | 7,887 | 9,094 | 9,808 | 9,388 |
| 2012 | 8,876 | 9,899 | 9,255 | 9,866 | 8,598 | 8,981 | 8,922 | 7,622 | 8,289 | 10,456 | 9,739 | 9,505 |
| 2013 | 10,003 | 10,275 | 8,841 | 8,748 | 9,917 | 9,812 | 9,587 | 9,834 | 9,511 | 9,864 | 9,303 | 10,496 |
| 2014 | 11,270 | 9,514 | 8,643 | 9,181 | 9,743 | 9,691 | 9,584 | 9,078 | 9,364 | 9,335 | 8,472 | 8,735 |
| 2015 | 8,516 | 9,347 | 9,909 | 9,773 | 10,729 | 9,575 | 8,503 | 10,251 | 9,595 | 9,266 | 10,066 | 10,447 |
| 2016 | 10,685 | 11,641 | 10,325 | 10,277 | 10,669 | 10,907 | 10,259 | 11,464 | 10,544 | 10,393 | 11,487 | 11,687 |
| 2017 | 11,078 | 11,221 | 10,898 | 11,032 | 11,453 | 9,415 | 8,954 | 9,124 | 8,056 | 8,155 | 7,047 | 7,162 |
| 2018 | 8,571 | 8,724 | 9,424 | 9,077 | 8,924 | 8,688 | 8,208 | 7,004 | 7,238 | 7,476 | 8,395 | 8,233 |
| 2019 | 8,994 | 7,872 | 7,097 | 7,638 | 8,182 | 8,124 | 8,147 | 7,451 | 7,527 | 7,547 | 8,529 | 8,826 |
| 2020 | 8,507 | 9,021 | 11,082 | 11,848 | 12,321 | 11,895 | 9,750 | 9,632 | 8,283 | 8,009 | 8,156 | 7,899 |
| 2021 | 9,330 | 8,551 | 7,989 | 9,804 | 8,784 | 8,955 | 7,646 | 8,501 | 7,743 | 7,801 | 7,784 | 7,922 |
| 2022 | 8,282 | 7,691 | 8,021 | 8,500 | 9,348 | 7,887 | 8,381 | 8,054 | 7,417 | 8,449 | 8,557 | 8,498 |
| 2023 | 8,988 | 8,690 | 8,743 | 9,047 | 8,951 | 8,544 | 8,345 | 7,328 | 7,079 | 7,859 | 8,075 | 6,683 |
| 2024 | 7,554 | |||||||||||
| - = No Data Reported; -- = Not Applicable; NA = Not Available; W = Withheld to avoid disclosure of individual company data. |
| Release Date: 3/29/2024 |
| Next Release Date: 4/30/2024 |