|
Download Data (XLS File) |
|
||||||||
|
||||||||
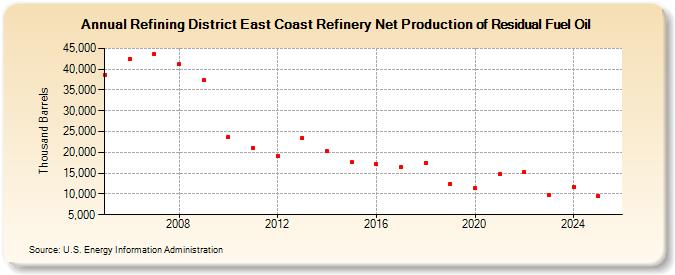
| Refining District East Coast Refinery Net Production of Residual Fuel Oil (Thousand Barrels) | ||||||||
| Decade | Year-0 | Year-1 | Year-2 | Year-3 | Year-4 | Year-5 | Year-6 | Year-7 | Year-8 | Year-9 |
|---|---|---|---|---|---|---|---|---|---|---|
| 2000's | 38,624 | 42,505 | 43,618 | 41,127 | 37,278 | |||||
| 2010's | 23,699 | 21,133 | 19,163 | 23,467 | 20,272 | 17,647 | 17,090 | 16,434 | 17,523 | 12,419 |
| 2020's | 11,337 | 14,735 | 15,216 | 9,825 |
| - = No Data Reported; -- = Not Applicable; NA = Not Available; W = Withheld to avoid disclosure of individual company data. |
| Release Date: 6/28/2024 |
| Next Release Date: 8/30/2024 |