|
Download Data (XLS File) |
|
||||||||
|
||||||||
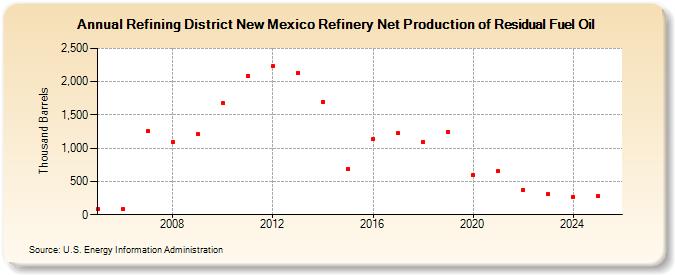
| Refining District New Mexico Refinery Net Production of Residual Fuel Oil (Thousand Barrels) | ||||||||
| Decade | Year-0 | Year-1 | Year-2 | Year-3 | Year-4 | Year-5 | Year-6 | Year-7 | Year-8 | Year-9 |
|---|---|---|---|---|---|---|---|---|---|---|
| 2000's | 81 | 85 | 1,257 | 1,087 | 1,209 | |||||
| 2010's | 1,673 | 2,086 | 2,230 | 2,134 | 1,701 | 691 | 1,131 | 1,224 | 1,096 | 1,245 |
| 2020's | 599 | 654 | 369 | 307 |
| - = No Data Reported; -- = Not Applicable; NA = Not Available; W = Withheld to avoid disclosure of individual company data. |
| Release Date: 3/29/2024 |
| Next Release Date: 8/30/2024 |