|
Download Data (XLS File) |
|
||||||||
|
||||||||
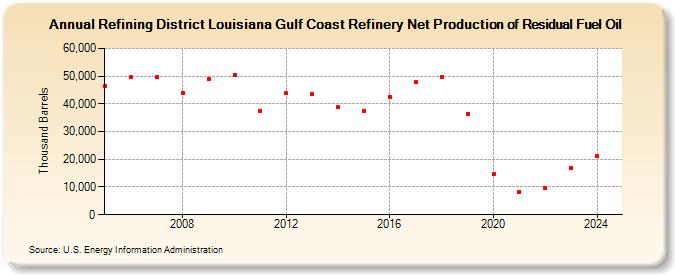
| Refining District Louisiana Gulf Coast Refinery Net Production of Residual Fuel Oil (Thousand Barrels) | ||||||||
| Decade | Year-0 | Year-1 | Year-2 | Year-3 | Year-4 | Year-5 | Year-6 | Year-7 | Year-8 | Year-9 |
|---|---|---|---|---|---|---|---|---|---|---|
| 2000's | 46,517 | 49,637 | 49,655 | 43,773 | 49,117 | |||||
| 2010's | 50,410 | 37,570 | 43,892 | 43,477 | 38,683 | 37,580 | 42,620 | 47,816 | 49,744 | 36,155 |
| 2020's | 14,597 | 8,255 | 9,570 | 16,923 |
| - = No Data Reported; -- = Not Applicable; NA = Not Available; W = Withheld to avoid disclosure of individual company data. |
| Release Date: 6/28/2024 |
| Next Release Date: 8/30/2024 |