|
Download Data (XLS File) |
|
||||||||
|
||||||||
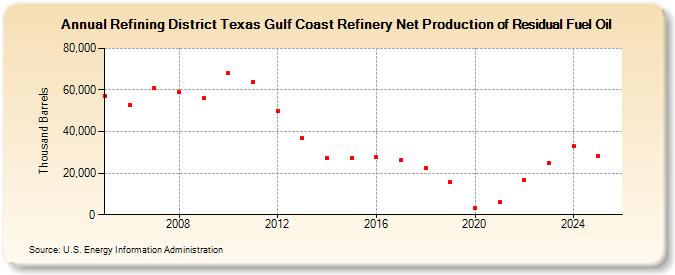
| Refining District Texas Gulf Coast Refinery Net Production of Residual Fuel Oil (Thousand Barrels) | ||||||||
| Decade | Year-0 | Year-1 | Year-2 | Year-3 | Year-4 | Year-5 | Year-6 | Year-7 | Year-8 | Year-9 |
|---|---|---|---|---|---|---|---|---|---|---|
| 2000's | 57,131 | 52,809 | 60,727 | 59,036 | 56,122 | |||||
| 2010's | 68,016 | 63,860 | 49,782 | 36,869 | 27,061 | 27,486 | 27,863 | 26,203 | 22,681 | 15,653 |
| 2020's | 3,174 | 6,149 | 16,718 | 24,885 |
| - = No Data Reported; -- = Not Applicable; NA = Not Available; W = Withheld to avoid disclosure of individual company data. |
| Release Date: 8/30/2024 |
| Next Release Date: 8/29/2025 |