|
Download Data (XLS File) |
|
||||||||
|
||||||||
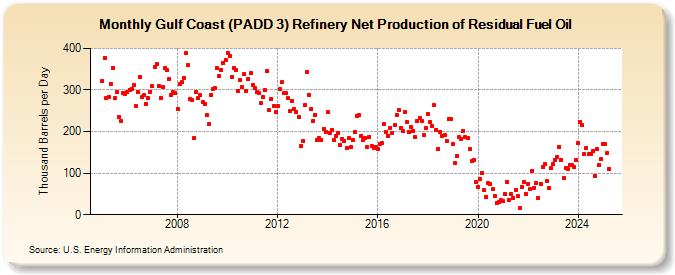
| Gulf Coast (PADD 3) Refinery Net Production of Residual Fuel Oil (Thousand Barrels per Day) | ||||||||
| Year | Jan | Feb | Mar | Apr | May | Jun | Jul | Aug | Sep | Oct | Nov | Dec |
|---|---|---|---|---|---|---|---|---|---|---|---|---|
| 2005 | 322 | 378 | 281 | 282 | 315 | 353 | 280 | 295 | 234 | 225 | 293 | 290 |
| 2006 | 294 | 301 | 303 | 311 | 262 | 294 | 331 | 283 | 287 | 266 | 280 | 296 |
| 2007 | 309 | 355 | 363 | 309 | 281 | 307 | 352 | 347 | 326 | 289 | 295 | 292 |
| 2008 | 255 | 315 | 318 | 329 | 389 | 360 | 278 | 277 | 184 | 295 | 280 | 287 |
| 2009 | 270 | 267 | 239 | 217 | 289 | 303 | 304 | 352 | 333 | 348 | 364 | 373 |
| 2010 | 390 | 381 | 332 | 354 | 347 | 298 | 324 | 306 | 339 | 298 | 327 | 340 |
| 2011 | 313 | 304 | 295 | 292 | 268 | 283 | 299 | 346 | 252 | 278 | 261 | 246 |
| 2012 | 261 | 302 | 319 | 292 | 292 | 280 | 249 | 273 | 254 | 247 | 235 | 165 |
| 2013 | 177 | 265 | 343 | 289 | 255 | 226 | 240 | 180 | 184 | 180 | 207 | 199 |
| 2014 | 246 | 196 | 204 | 180 | 190 | 196 | 168 | 183 | 178 | 160 | 184 | 162 |
| 2015 | 180 | 198 | 238 | 239 | 189 | 180 | 184 | 164 | 187 | 166 | 160 | 163 |
| 2016 | 159 | 171 | 173 | 217 | 199 | 190 | 209 | 197 | 215 | 241 | 253 | 209 |
| 2017 | 201 | 248 | 222 | 199 | 212 | 202 | 186 | 225 | 232 | 225 | 192 | 209 |
| 2018 | 242 | 223 | 213 | 263 | 204 | 158 | 200 | 189 | 191 | 178 | 230 | 230 |
| 2019 | 169 | 124 | 141 | 186 | 183 | 202 | 186 | 185 | 157 | 129 | 132 | 78 |
| 2020 | 66 | 87 | 100 | 60 | 42 | 76 | 74 | 61 | 46 | 28 | 31 | 35 |
| 2021 | 32 | 51 | 79 | 36 | 50 | 40 | 59 | 45 | 15 | 67 | 79 | 51 |
| 2022 | 74 | 61 | 106 | 65 | 76 | 41 | 75 | 114 | 121 | 81 | 64 | 112 |
| 2023 | 121 | 131 | 140 | 163 | 132 | 89 | 113 | 110 | 119 | 119 | 115 | 131 |
| 2024 | 172 | |||||||||||
| - = No Data Reported; -- = Not Applicable; NA = Not Available; W = Withheld to avoid disclosure of individual company data. |
| Release Date: 3/29/2024 |
| Next Release Date: 4/30/2024 |