|
Download Data (XLS File) |
|
||||||||
|
||||||||
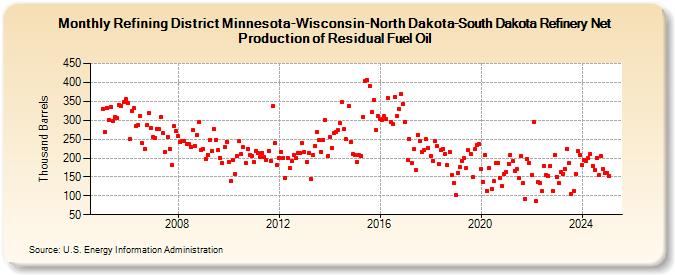
| Refining District Minnesota-Wisconsin-North Dakota-South Dakota Refinery Net Production of Residual Fuel Oil (Thousand Barrels) | ||||||||
| Year | Jan | Feb | Mar | Apr | May | Jun | Jul | Aug | Sep | Oct | Nov | Dec |
|---|---|---|---|---|---|---|---|---|---|---|---|---|
| 2005 | 330 | 268 | 332 | 301 | 335 | 298 | 309 | 306 | 340 | 338 | 347 | 355 |
| 2006 | 345 | 250 | 325 | 331 | 284 | 286 | 310 | 239 | 223 | 287 | 318 | 279 |
| 2007 | 255 | 253 | 277 | 276 | 308 | 265 | 216 | 256 | 224 | 181 | 284 | 271 |
| 2008 | 257 | 242 | 246 | 246 | 238 | 237 | 230 | 273 | 233 | 260 | 295 | 220 |
| 2009 | 223 | 197 | 209 | 248 | 219 | 277 | 248 | 220 | 201 | 187 | 229 | 243 |
| 2010 | 189 | 138 | 195 | 157 | 205 | 244 | 211 | 228 | 188 | 225 | 207 | 205 |
| 2011 | 190 | 219 | 213 | 203 | 214 | 203 | 195 | 218 | 192 | 337 | 239 | 181 |
| 2012 | 201 | 216 | 201 | 148 | 201 | 174 | 191 | 207 | 199 | 214 | 213 | 239 |
| 2013 | 217 | 189 | 213 | 144 | 207 | 233 | 270 | 247 | 217 | 248 | 300 | 204 |
| 2014 | 255 | 226 | 266 | 270 | 274 | 292 | 348 | 276 | 249 | 338 | 243 | 210 |
| 2015 | 208 | 190 | 207 | 204 | 308 | 404 | 406 | 391 | 321 | 354 | 275 | 310 |
| 2016 | 304 | 301 | 310 | 302 | 358 | 295 | 291 | 362 | 311 | 329 | 370 | 342 |
| 2017 | 296 | 195 | 250 | 186 | 223 | 169 | 261 | 245 | 216 | 221 | 249 | 227 |
| 2018 | 205 | 193 | 244 | 231 | 185 | 220 | 225 | 210 | 181 | 217 | 154 | 134 |
| 2019 | 102 | 161 | 175 | 193 | 199 | 173 | 220 | 211 | 149 | 223 | 235 | 238 |
| 2020 | 171 | 137 | 207 | 113 | 174 | 118 | 138 | 187 | 186 | 148 | 126 | 158 |
| 2021 | 163 | 185 | 209 | 192 | 166 | 170 | 147 | 204 | 133 | 92 | 197 | 187 |
| 2022 | 155 | 295 | 86 | 137 | 133 | 112 | 180 | 155 | 153 | 180 | 114 | 209 |
| 2023 | 151 | 133 | 164 | 159 | 171 | 224 | 186 | 104 | 113 | 157 | 218 | 209 |
| 2024 | 182 | |||||||||||
| - = No Data Reported; -- = Not Applicable; NA = Not Available; W = Withheld to avoid disclosure of individual company data. |
| Release Date: 3/29/2024 |
| Next Release Date: 4/30/2024 |