|
Download Data (XLS File) |
|
||||||||
|
||||||||
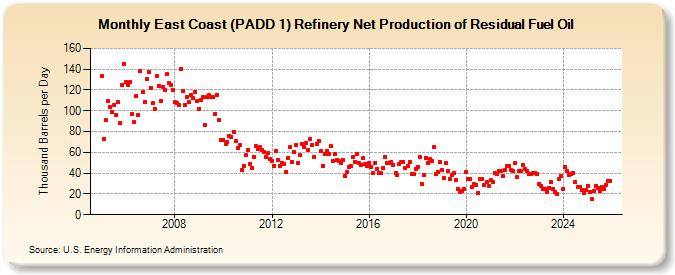
| East Coast (PADD 1) Refinery Net Production of Residual Fuel Oil (Thousand Barrels per Day) | ||||||||
| Year | Jan | Feb | Mar | Apr | May | Jun | Jul | Aug | Sep | Oct | Nov | Dec |
|---|---|---|---|---|---|---|---|---|---|---|---|---|
| 2005 | 133 | 73 | 91 | 109 | 104 | 99 | 106 | 96 | 108 | 88 | 125 | 145 |
| 2006 | 128 | 125 | 128 | 97 | 89 | 114 | 96 | 138 | 118 | 108 | 131 | 137 |
| 2007 | 122 | 107 | 102 | 133 | 124 | 109 | 123 | 120 | 135 | 127 | 125 | 120 |
| 2008 | 108 | 107 | 106 | 140 | 119 | 106 | 113 | 108 | 115 | 112 | 118 | 109 |
| 2009 | 102 | 110 | 113 | 86 | 113 | 115 | 113 | 113 | 97 | 115 | 91 | 72 |
| 2010 | 72 | 68 | 70 | 76 | 75 | 80 | 71 | 64 | 67 | 43 | 47 | 57 |
| 2011 | 62 | 49 | 45 | 56 | 66 | 63 | 65 | 62 | 60 | 56 | 59 | 54 |
| 2012 | 52 | 47 | 61 | 53 | 47 | 50 | 49 | 41 | 55 | 65 | 51 | 60 |
| 2013 | 67 | 50 | 57 | 68 | 65 | 69 | 62 | 73 | 67 | 56 | 68 | 71 |
| 2014 | 61 | 47 | 58 | 61 | 58 | 66 | 52 | 58 | 53 | 52 | 50 | 53 |
| 2015 | 37 | 41 | 46 | 47 | 56 | 51 | 58 | 50 | 48 | 55 | 49 | 47 |
| 2016 | 50 | 46 | 40 | 50 | 44 | 40 | 40 | 45 | 56 | 50 | 50 | 51 |
| 2017 | 48 | 40 | 38 | 49 | 51 | 51 | 45 | 47 | 51 | 39 | 39 | 44 |
| 2018 | 46 | 56 | 30 | 38 | 55 | 50 | 54 | 52 | 65 | 39 | 41 | 51 |
| 2019 | 43 | 35 | 50 | 42 | 34 | 38 | 40 | 33 | 25 | 22 | 23 | 25 |
| 2020 | 41 | 34 | 34 | 27 | 30 | 29 | 21 | 34 | 34 | 29 | 31 | 28 |
| 2021 | 33 | 31 | 40 | 39 | 42 | 42 | 37 | 43 | 47 | 47 | 43 | 42 |
| 2022 | 50 | 36 | 42 | 42 | 48 | 44 | 42 | 39 | 39 | 40 | 40 | 39 |
| 2023 | 30 | 28 | 25 | 25 | 22 | 26 | 31 | 25 | 22 | 20 | 34 | 37 |
| 2024 | 25 | 46 | ||||||||||
| - = No Data Reported; -- = Not Applicable; NA = Not Available; W = Withheld to avoid disclosure of individual company data. |
| Release Date: 4/30/2024 |
| Next Release Date: 5/31/2024 |