|
Download Data (XLS File) |
|
||||||||
|
||||||||
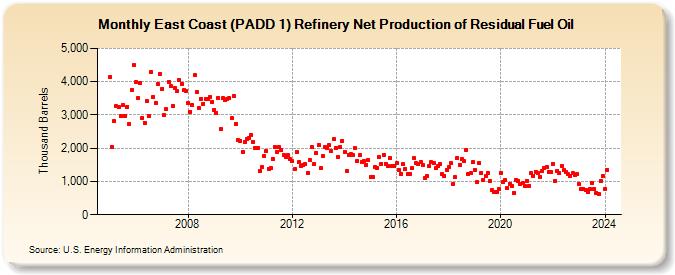
| East Coast (PADD 1) Refinery Net Production of Residual Fuel Oil (Thousand Barrels) | ||||||||
| Year | Jan | Feb | Mar | Apr | May | Jun | Jul | Aug | Sep | Oct | Nov | Dec |
|---|---|---|---|---|---|---|---|---|---|---|---|---|
| 2005 | 4,133 | 2,035 | 2,807 | 3,255 | 3,236 | 2,956 | 3,294 | 2,982 | 3,246 | 2,720 | 3,757 | 4,508 |
| 2006 | 3,983 | 3,505 | 3,965 | 2,920 | 2,772 | 3,423 | 2,976 | 4,293 | 3,543 | 3,360 | 3,926 | 4,242 |
| 2007 | 3,792 | 2,991 | 3,169 | 3,993 | 3,859 | 3,263 | 3,805 | 3,707 | 4,048 | 3,931 | 3,749 | 3,728 |
| 2008 | 3,359 | 3,095 | 3,291 | 4,191 | 3,677 | 3,193 | 3,492 | 3,340 | 3,464 | 3,474 | 3,539 | 3,389 |
| 2009 | 3,159 | 3,066 | 3,516 | 2,575 | 3,501 | 3,462 | 3,489 | 3,497 | 2,896 | 3,574 | 2,738 | 2,232 |
| 2010 | 2,222 | 1,890 | 2,179 | 2,271 | 2,311 | 2,400 | 2,194 | 1,997 | 2,019 | 1,326 | 1,423 | 1,770 |
| 2011 | 1,930 | 1,382 | 1,398 | 1,685 | 2,045 | 1,895 | 2,023 | 1,937 | 1,793 | 1,734 | 1,784 | 1,663 |
| 2012 | 1,608 | 1,363 | 1,895 | 1,584 | 1,459 | 1,506 | 1,524 | 1,268 | 1,649 | 2,021 | 1,526 | 1,862 |
| 2013 | 2,092 | 1,394 | 1,779 | 2,036 | 2,016 | 2,082 | 1,913 | 2,265 | 2,019 | 1,746 | 2,038 | 2,213 |
| 2014 | 1,895 | 1,325 | 1,798 | 1,823 | 1,794 | 1,994 | 1,612 | 1,783 | 1,586 | 1,622 | 1,507 | 1,637 |
| 2015 | 1,136 | 1,147 | 1,420 | 1,411 | 1,724 | 1,538 | 1,809 | 1,535 | 1,450 | 1,690 | 1,462 | 1,452 |
| 2016 | 1,550 | 1,346 | 1,233 | 1,511 | 1,368 | 1,213 | 1,228 | 1,406 | 1,694 | 1,542 | 1,513 | 1,588 |
| 2017 | 1,494 | 1,118 | 1,163 | 1,476 | 1,573 | 1,544 | 1,394 | 1,462 | 1,518 | 1,218 | 1,164 | 1,354 |
| 2018 | 1,421 | 1,554 | 936 | 1,128 | 1,714 | 1,507 | 1,682 | 1,606 | 1,958 | 1,217 | 1,243 | 1,574 |
| 2019 | 1,348 | 979 | 1,561 | 1,264 | 1,052 | 1,154 | 1,240 | 1,013 | 736 | 689 | 686 | 763 |
| 2020 | 1,262 | 990 | 1,047 | 801 | 936 | 876 | 654 | 1,055 | 1,021 | 911 | 943 | 878 |
| 2021 | 1,022 | 871 | 1,239 | 1,175 | 1,292 | 1,269 | 1,147 | 1,327 | 1,409 | 1,444 | 1,288 | 1,289 |
| 2022 | 1,536 | 1,018 | 1,317 | 1,260 | 1,473 | 1,332 | 1,287 | 1,209 | 1,168 | 1,244 | 1,197 | 1,219 |
| 2023 | 929 | 774 | 787 | 742 | 678 | 771 | 956 | 779 | 667 | 632 | 1,025 | 1,150 |
| 2024 | 786 | |||||||||||
| - = No Data Reported; -- = Not Applicable; NA = Not Available; W = Withheld to avoid disclosure of individual company data. |
| Release Date: 3/29/2024 |
| Next Release Date: 4/30/2024 |