|
Download Data (XLS File) |
|
||||||||
|
||||||||
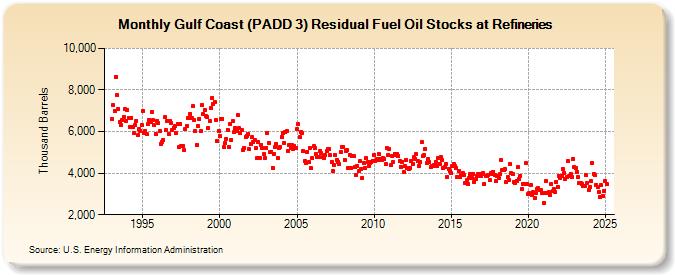
| Gulf Coast (PADD 3) Residual Fuel Oil Stocks at Refineries (Thousand Barrels) | ||||||||
| Year | Jan | Feb | Mar | Apr | May | Jun | Jul | Aug | Sep | Oct | Nov | Dec |
|---|---|---|---|---|---|---|---|---|---|---|---|---|
| 1993 | 6,603 | 7,275 | 6,980 | 8,647 | 7,765 | 7,087 | 6,472 | 6,299 | 6,544 | 6,691 | 7,084 | 6,525 |
| 1994 | 7,041 | 6,669 | 6,222 | 6,675 | 6,210 | 5,921 | 6,294 | 6,514 | 5,812 | 6,117 | 6,050 | 6,318 |
| 1995 | 6,996 | 5,943 | 6,046 | 5,869 | 6,355 | 6,560 | 6,462 | 6,961 | 6,547 | 6,308 | 5,883 | 6,525 |
| 1996 | 6,420 | 6,003 | 5,408 | 5,513 | 5,611 | 6,692 | 6,070 | 6,525 | 5,898 | 6,497 | 6,398 | 6,078 |
| 1997 | 6,179 | 6,265 | 5,936 | 6,381 | 5,243 | 6,380 | 5,315 | 5,311 | 5,092 | 6,109 | 6,281 | 6,631 |
| 1998 | 6,634 | 6,837 | 6,665 | 7,209 | 6,559 | 6,026 | 5,366 | 6,268 | 6,616 | 6,009 | 7,273 | 6,841 |
| 1999 | 7,028 | 6,743 | 6,711 | 6,180 | 6,519 | 7,133 | 7,617 | 7,325 | 7,429 | 6,566 | 5,537 | 6,041 |
| 2000 | 5,774 | 6,610 | 6,626 | 5,241 | 5,430 | 5,642 | 6,092 | 5,269 | 6,361 | 5,594 | 6,491 | 5,956 |
| 2001 | 6,161 | 6,004 | 6,784 | 6,147 | 5,930 | 6,081 | 5,091 | 5,229 | 5,754 | 5,805 | 5,892 | 5,146 |
| 2002 | 5,400 | 5,719 | 5,493 | 5,587 | 5,188 | 4,705 | 5,501 | 4,731 | 5,375 | 5,210 | 4,901 | 4,717 |
| 2003 | 5,224 | 5,951 | 5,465 | 5,004 | 5,029 | 4,264 | 4,924 | 5,244 | 5,425 | 4,722 | 5,226 | 5,261 |
| 2004 | 5,726 | 5,946 | 5,472 | 5,966 | 6,005 | 5,082 | 5,356 | 5,188 | 5,368 | 5,180 | 5,316 | 5,185 |
| 2005 | 6,099 | 6,358 | 5,714 | 5,978 | 5,929 | 5,046 | 4,570 | 4,471 | 5,039 | 4,521 | 5,215 | 4,233 |
| 2006 | 4,722 | 5,292 | 5,205 | 4,932 | 4,767 | 4,758 | 5,085 | 4,951 | 4,756 | 4,746 | 4,874 | 5,041 |
| 2007 | 5,152 | 5,143 | 4,855 | 4,553 | 4,092 | 4,413 | 4,860 | 4,654 | 4,554 | 4,427 | 5,024 | 5,261 |
| 2008 | 5,268 | 4,650 | 5,084 | 5,122 | 4,268 | 4,881 | 4,259 | 4,816 | 4,826 | 4,280 | 3,904 | 4,345 |
| 2009 | 4,079 | 4,565 | 4,220 | 3,781 | 4,493 | 4,233 | 4,718 | 4,517 | 4,360 | 4,503 | 4,548 | 4,604 |
| 2010 | 4,886 | 4,597 | 4,666 | 4,651 | 4,903 | 4,662 | 4,610 | 4,749 | 4,668 | 4,416 | 5,214 | 4,874 |
| 2011 | 5,144 | 4,400 | 4,834 | 4,543 | 4,937 | 4,869 | 4,924 | 4,829 | 4,570 | 4,307 | 4,553 | 4,055 |
| 2012 | 4,329 | 4,623 | 4,242 | 4,179 | 4,267 | 4,598 | 4,430 | 4,772 | 4,696 | 4,932 | 4,574 | 4,356 |
| 2013 | 4,550 | 5,480 | 4,824 | 4,867 | 5,183 | 4,487 | 4,659 | 4,522 | 4,298 | 4,352 | 4,366 | 4,383 |
| 2014 | 4,553 | 4,332 | 4,724 | 4,447 | 4,774 | 4,651 | 4,241 | 4,308 | 4,461 | 3,812 | 4,212 | 4,084 |
| 2015 | 4,030 | 4,338 | 4,457 | 4,329 | 4,237 | 3,822 | 4,096 | 3,799 | 3,929 | 3,992 | 3,934 | 3,535 |
| 2016 | 3,654 | 3,480 | 3,760 | 3,949 | 3,784 | 3,972 | 3,588 | 3,697 | 3,876 | 3,947 | 3,978 | 3,839 |
| 2017 | 3,953 | 3,991 | 3,476 | 3,882 | 3,848 | 3,917 | 3,650 | 4,006 | 3,967 | 4,070 | 3,892 | 3,630 |
| 2018 | 3,873 | 3,770 | 3,944 | 4,634 | 4,159 | 4,158 | 4,187 | 3,591 | 3,796 | 3,673 | 4,448 | 3,997 |
| 2019 | 3,960 | 3,593 | 3,542 | 3,645 | 4,283 | 3,717 | 3,882 | 3,253 | 3,459 | 3,454 | 4,465 | 3,500 |
| 2020 | 2,973 | 3,050 | 3,419 | 2,957 | 3,076 | 2,827 | 3,036 | 3,248 | 3,267 | 3,186 | 3,173 | 3,031 |
| 2021 | 2,562 | 3,030 | 3,604 | 3,047 | 3,079 | 2,951 | 3,471 | 3,152 | 3,258 | 3,097 | 3,575 | 3,356 |
| 2022 | 3,882 | 3,764 | 3,885 | 4,208 | 4,014 | 3,706 | 3,829 | 4,593 | 3,879 | 3,982 | 3,794 | 4,688 |
| 2023 | 4,278 | 4,243 | 4,074 | 3,816 | 3,504 | 3,534 | 3,497 | 3,358 | 3,404 | 3,891 | 3,535 | 3,188 |
| 2024 | 3,335 | 3,599 | 4,480 | 3,980 | ||||||||
| - = No Data Reported; -- = Not Applicable; NA = Not Available; W = Withheld to avoid disclosure of individual company data. |
| Release Date: 6/28/2024 |
| Next Release Date: 7/31/2024 |